
|
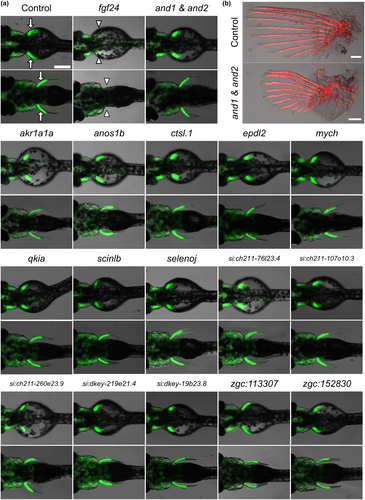
Fig. 4 Loss-of-function analysis of candidate genes by the CRISPR/Cas9 system. (a) Dorsal view of 2 dpf (50–54 hpf, upper photos) and 5 dpf (122–126 hpf, lower photos) zebrafish after the candidate gene was knocked out (crispant). The gt1116A strain (trapping the prdm16 gene) was used to visualize the pectoral fin mesenchyme, and the pectoral fins are indicated by arrows in the control (upper left). EGFP fluorescence and bright-field images are merged in all photos. fgf24 F0 zebrafish did not form pectoral fin buds (arrowheads). Scale bars: 250 μm. (b) AR-stained image of the pectoral fin of an and1/and2 double-knockout juvenile. AR fluorescence image and bright-field images are merged. Scale bars: 250 μm