
Image
|
Figure Caption
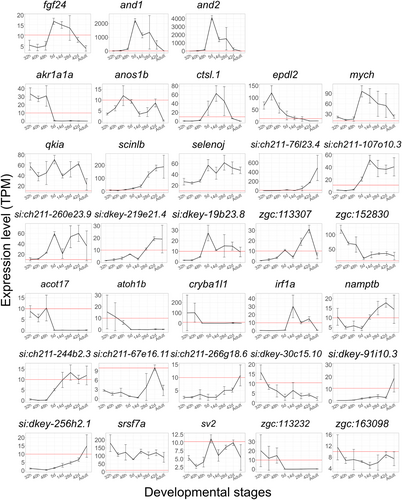
Fig. 3 Expression levels of 33 candidate genes during pectoral fin development. The line graph shows the expression levels (TPM) at each developmental stage (32 hpf, 40 hpf, 48 hpf, 5 dpf, 14 dpf, 28 dpf, 42 dpf, and the adult stage). Red lines show the TPM value of 10. Error bars indicate standard deviation.
Acknowledgments
This image is the copyrighted work of the attributed author or publisher, and
ZFIN has permission only to display this image to its users.
Additional permissions should be obtained from the applicable author or publisher of the image.
Full text @ Dev. Growth Diff.