
|
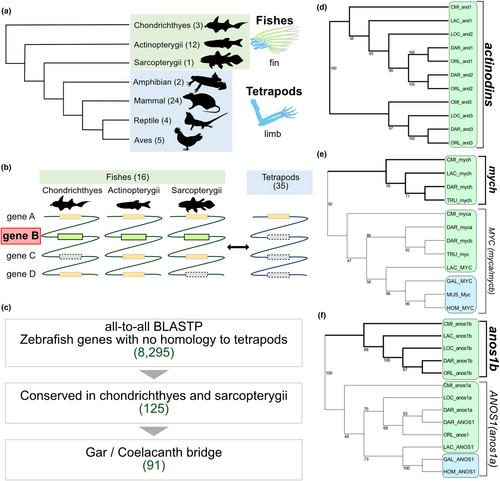
Fig. 1 Identification of fish-specific genes. (a) Schematic diagram of phylogenetic relationships between fish and tetrapods. Numbers in parentheses for each lineage indicate the number of species used in the BlastP analysis. In the skeleton images, blue and green areas show endochondral (endoskeleton) and membrane bone (fin ray), respectively. (b) Schematic diagram representing fish-specific genes. Rectangles indicate genes in the genome (indicated by lines), and dotted rectangles indicate genes that were not present in the genome of the lineage. Gene B, but not genes A, C, and D, represents a fish-specific gene like those we sought in this study. (c) Flowchart showing the process of identifying fish-specific genes. Numbers in parentheses represent the number of genes in zebrafish at each step of the process. (d–f) Examples of fish-specific gene phylogenetic trees. Green indicates fish and blue indicates tetrapods. Bold lines represent clades of fish-specific genes. Genes that did not have gene names in the Ensembl database were assigned gene names as follows: ENSCMIP00000038549, CMI_and1; ENSCMIP00000004194, CMI_and3; ENSCMIP00000004396, CMI_mych; ENSCMIP00000019689, CMI_anos1b. CMI, Callorhinchus milii; DAR, Danio rerio; GAL, Gallus gallus; HOM, Homo sapiens; LAC, Latimeria chalumnae; LOC, Lepisosteus oculatus; MUS, Mus musculus; ORL, Oryzias latipes; TRU, Takifugu rubripes.