
|
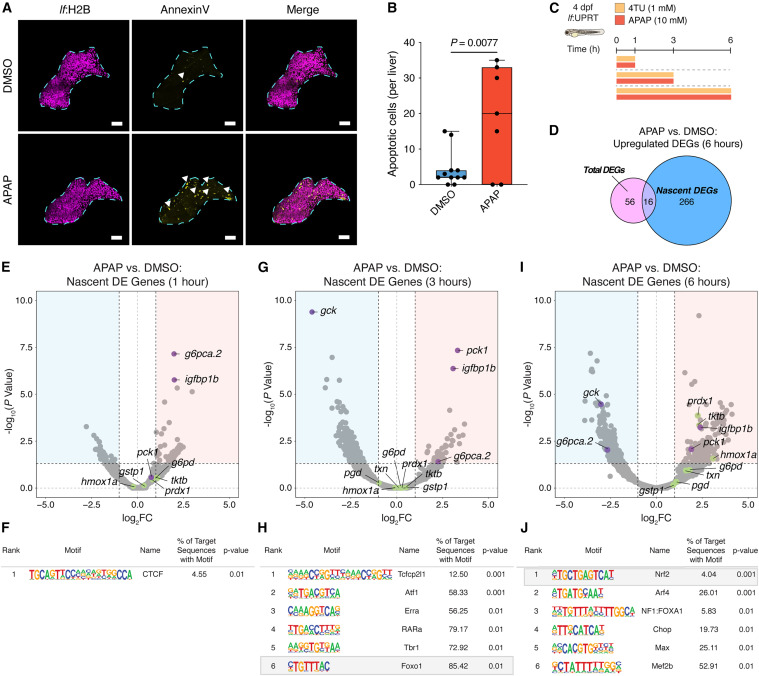
Fig. 2 SLAM-ITseq reveals temporal dynamics of nascent gene expression in hepatocytes following liver injury (A) Representative multiphoton images of hepatocyte apoptosis (annexin V+ hepatocytes) in 5 dpf zebrafish livers treated with DMSO or APAP for 24 h. Cyan dashed line borders the zebrafish liver. White arrows represent apoptotic hepatocytes. Scale bars, 50 μm. (B) Quantification of hepatocyte apoptosis in 5 dpf zebrafish livers treated with DMSO or APAP for 24 h. Data are shown as median and interquartile range, n = 7. p value was calculated using an unpaired two-tailed Student’s t test comparing each sample to the respective DMSO control. (C) Workflow for performing SLAM-ITseq in the larval zebrafish liver injury model. 4 dpf larvae were simultaneously treated with DMSO or APAP in the presence of 4TU for 1, 3, and 6 h. (D) Venn diagram depicting the overlap of total and nascent genes that were differentially upregulated in zebrafish larvae treated with APAP for 6 h. (E and F) Volcano plot (E) and HOMER motif analysis of genes (F) from SLAM-ITseq of zebrafish larvae treated with DMSO or APAP for 1 h. Genes within red area of volcano plots are significantly upregulated (log2FC > 0.6, p < 0.05), and genes within blue area of volcano plots are significantly downregulated (log2FC < 0.6, p < 0.05). Green symbols represent Nrf2 target genes, whereas purple symbols represent FOXO1 target genes. (G and H) Volcano plot (G) and HOMER motif analysis of genes (H) from SLAM-ITseq of zebrafish larvae treated with DMSO or APAP for 3 h. Genes within red area of volcano plots are significantly upregulated (log2FC > 0.6, p < 0.05), and genes within blue area of volcano plots are significantly downregulated (log2FC < 0.6, p < 0.05). Green symbols represent Nrf2 target genes, whereas purple symbols represent FOXO1 target genes. (I and J) Volcano plot (I) and HOMER motif analysis of genes (J) from SLAM-ITseq of zebrafish larvae treated with DMSO or APAP for 6 h. Genes within red area of volcano plots are significantly upregulated (log2FC > 0.6, p < 0.05), and genes within blue area of volcano plots are significantly downregulated (log2FC < 0.6, p < 0.05). Green symbols represent Nrf2 target genes, whereas purple symbols represent FOXO1 target genes. See also Figure S2 and Table S1.
Reprinted from Developmental Cell, 59(7), Tan, V.W.T., Salmi, T.M., Karamalakis, A.P., Gillespie, A., Ong, A.J.S., Balic, J.J., Chan, Y.C., Bladen, C.E., Brown, K.K., Dawson, M.A., Cox, A.G., SLAM-ITseq identifies that Nrf2 induces liver regeneration through the pentose phosphate pathway, 898-910.e6, Copyright (2024) with permission from Elsevier. Full text @ Dev. Cell