
|
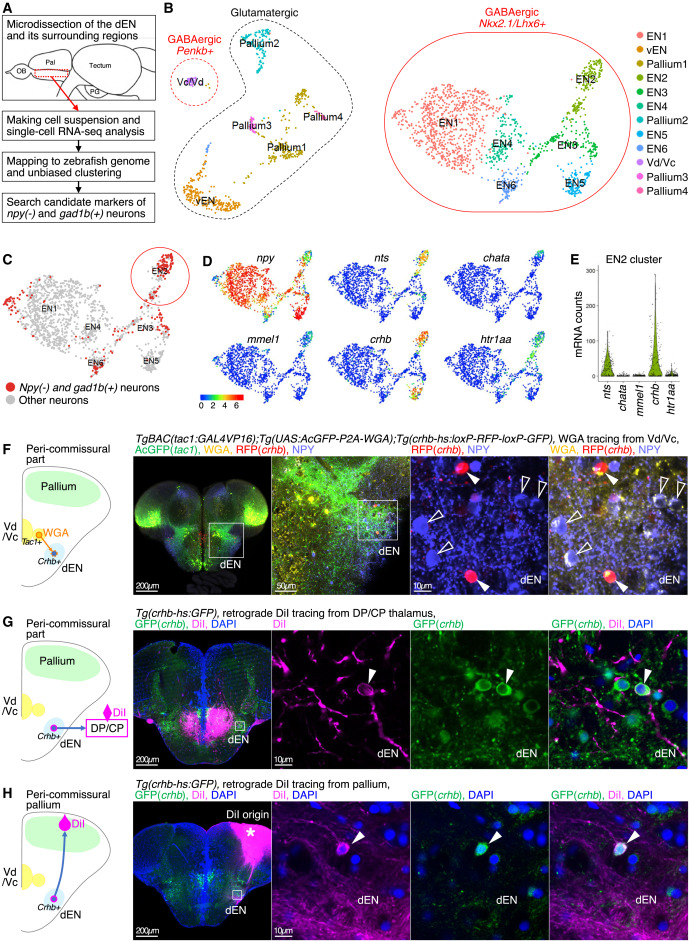
Fig. 6 scRNA-seq analysis of the zebrafish pallidum identified crhb as a marker of the thalamus-projecting dEN neurons, which also directly project to the pallium (A) An overview of the experimental strategy of the scRNA-seq analysis. (B) Uniform manifold approximation and projection (UMAP) plot displaying the result of clustering. Each dot represents one cell. Clusters are color coded. Only neuronal clusters are shown (n = 2,200 cells in total; see also Figure S5C for the detail). Clusters intrinsic to entopeduncular neurons are circled with the solid red line (EN1–6 clusters). Dashed red and black circles indicate Vd/Vc and pallium clusters, respectively. (C) UMAP plot showing the distribution of the npy-negative and gad1b-positive cells (red dots, n = 235 cells) and the other neurons (gray dots, n = 1,270 cells) in the six EN clusters. The npy-negative and gad1b-positive cells highly accumulated in the EN2 cluster (red circle). (D and E) Expression patterns of the top-five differentially expressed genes of the npy-negative and gad1b-positive cells in the EN2 cluster, determined by a Wilcoxon Rank-Sum test (see method details and Data S1 and S2). Natural log-normalized values of the expression levels are color coded on UMAP of the EN clusters in (D) (n = 1,505 cells). Distributions of mRNA counts from each EN2 neuron are violin plotted in (E) (n = 182 cells). Crhb showed the highest expression among them. (F) WGA tracing from the tac1+ Vd/Vc neurons and trans-synaptic WGA transfer to crhb+ dEN neurons. Immunohistochemistry of AcGFP (green), WGA (yellow), crhb (magenta), and NPY (light blue). Insets show the positions of the next panels, focusing on the dEN. Filled arrowheads indicate crhb-positive and NPY-negative neurons that accumulate WGA as much as that of crhb-negative and NPY-positive neurons (open arrowheads). The leftmost panel is MaxIP. Scale bars, 200 μm (leftmost panel), 50 μm (second panel from left), and 10 μm (right two panels). (G) DiI tracing from the DP/CP in Tg(crhb-hs:GFP) fish retrogradely labeled crhb+ dEN neurons. An inset in the leftmost panel shows the position of the right three panels. Arrowheads indicate retrogradely labeled crhb+ dEN neurons. The leftmost panel is MaxIP. Scale bars, 200 μm (leftmost panel) and 10 μm (right three panels). (H) Same as (G), but from the pallium. DiI solution was used instead of DiI crystal in this experiment (see method details). An asterisk indicates DiI origin.