
|
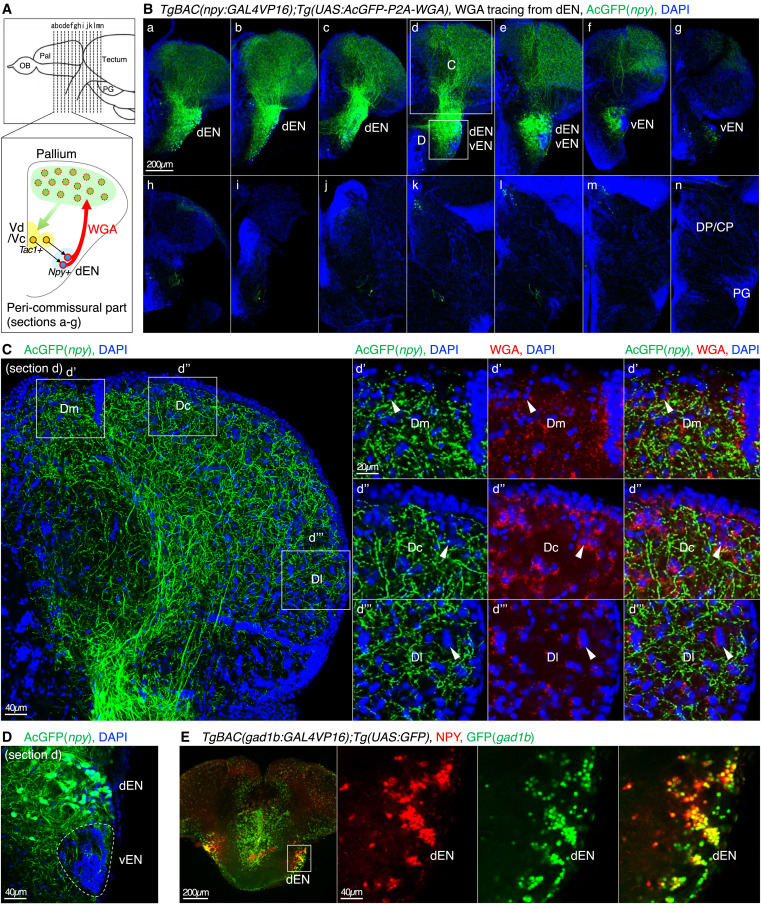
Fig. 4 The npy-positive inhibitory neurons in the dEN directly project to the pallium and not to the thalamus (A) Illustration of a coronal section depicting WGA expression in the npy+ dEN neurons and trans-synaptic WGA transfer to the pallial neurons. (B) Projection patterns of the npy+ neurons (AcGFP, green) to the pallium (DAPI, blue) in 12 successive coronal sections (a–n). In (d), insets show the positions of (C) and (D). MaxIP is shown. Scale bar, 200 μm. (C) WGA tracing from the npy+ dEN neurons and immunohistochemistry of AcGFP (green), WGA (red), and DAPI (blue). The left panel shows the pallium of section d, and insets show the positions of (d’)–(d’’’), focusing on the different pallial subdivisions Dm, Dc, and Dl. In (d’)–(d’’’), arrowheads indicate representative pallial neurons with WGA signals. Scale bars, 40 μm (left) and 20 μm (d’–d’’’). (D) A magnified view of the dEN-vEN region in (d). The vEN is circled with a dotted line. Scale bar, 40 μm. (E) Immunohistochemistry of gad1b+ neurons (GFP, green) and npy+ neurons (NPY, red) in TgBAC(gad1b:GAL4VP16);Tg(UAS:GFP) fish. An inset in the leftmost panel shows the position of the right three panels. NPY-immunoreactive cells were co-stained with GFP signals (rightmost panel). The leftmost panel is MaxIP. Scale bars, 200 μm (leftmost panel) and 40 μm (right three panels).