
|
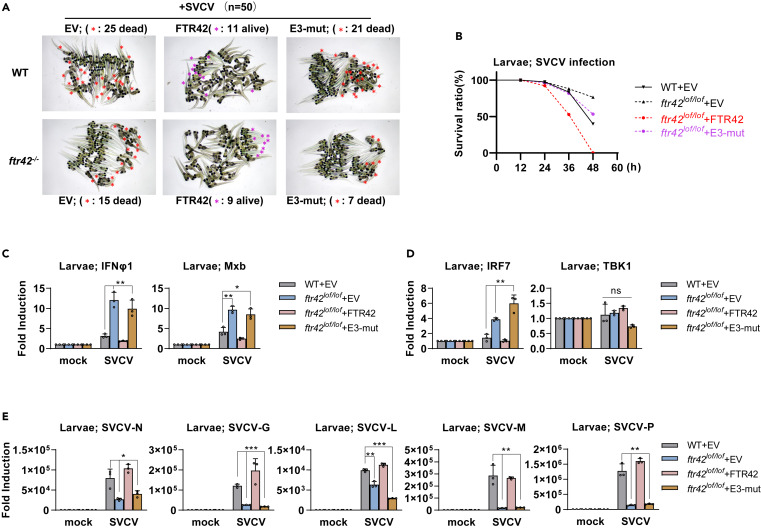
Fig. 8 FTR42 but not E3-mut reduces the susceptibility of ftr42lof/lof zebrafish to SVCV infection (A) Representative images of WT and ftr42lof/lof zebrafish larvae (4 dpf, n = 50 per group) after SVCV immersion challenge (5×10⁶ TCID50/mL) for 36 h. zebrafish larvae were raised from embryos that had been microinjected at one cell stage with FTR42 or E3-mut or empty vector (60 pg each) in a volume of 1 nL. (B) Survival ratios were calculated by counting deaths of WT and ftr42lof/lof zebrafish larvae (n = 50 per group), which were developed from embryos through microinjection and subsequently immersed with SVCV as in (A). (C–E) Transcriptional expression of ifnφ1 and mxb (C), irf7 and tbk1 (D), and five SVCV genes (E) were compared between WT and ftr42lof/lof zebrafish larvae, which were developed from embryos through microinjection and subsequently immersed for 48 h with SVCV as in (A). Zebrafish survival curves were analyzed by Log-Rank test. Data were shown as mean ± SD (N = 3). p values were calculated using two-way ANOVA analysis. ∗p < 0.05, ∗∗p < 0.01, ∗∗∗p < 0.001; ns, not significant.