
|
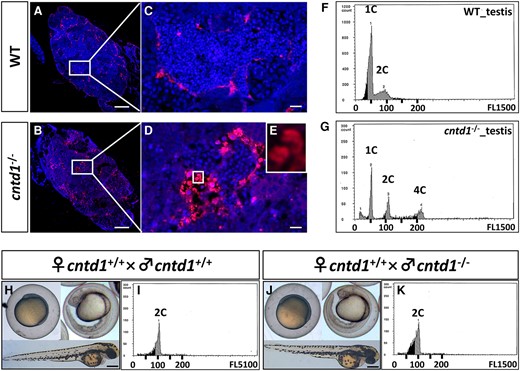
Fig. 3 Observations of spermatocyte apoptosis. A–D, TUNEL staining of testes from wild-type (WT) (A and C) and cntd1−/− zebrafish (B and D). Each group consists of four individuals. White boxes highlight the magnified areas. Scale bars in A and B and C and D represent 100 and 10 μm, respectively. (E) Magnification of the area indicated by the white box. F and G, Representative cytometric histograms of testes from WT (F) and cntd1−/− (G) zebrafish, with each group comprising three individuals. The terms 1C, 2C, and 4C denote haploidy, diploidy, and tetraploidy, respectively. H and J, Representative images of embryonic development in offspring obtained from cntd1+/+ females crossed with cntd1+/+ (H) and cntd1−/− (J) males, with a scale bar representing 250 μm. I and K, Cytometric histograms of embryos obtained from cntd1+/+ females crossed with cntd1+/+ (I) and cntd1−/− (K) males. Each group includes 20 individuals. The term 2C indicates diploidy.