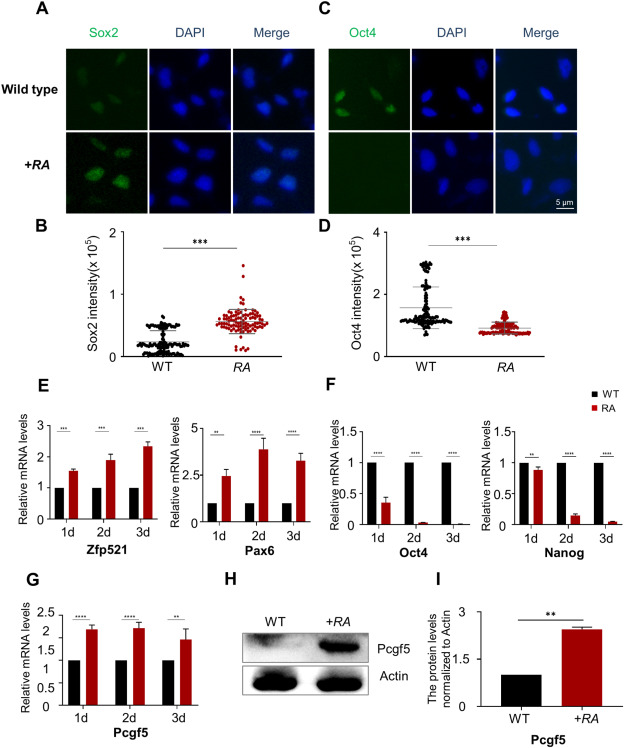
Fig. 1 Pcgf5 was upregulated during RA-induced neural induction in P19 cells. (A,C) Representative images show immunofluorescence of Sox2 and Oct4 from P19 cells with DMSO (Wild Type) or 0.5 μM RA (RA) induction. Scale bar, 5 μm. (B,D) Quantification of (A) and (C). More than 100 cells were counted in each experiment. (E,F,G) qPCR was used to analyse the expression of Zfp521, Pax6 and Oct4, Nanog and Pcgf5 during RA induction. (H,I) Western Blot was used to detect the level of Pcgf5 during RA induction. Full-length gels before cropping are noted in Fig. S4. Data are presented as means ± SEM of at least three independent experiments. (E-G,I), ** (p < 0.01),*** (p < 0.001), **** (p < 0.0001), ns: no significance.
Image
Figure Caption
Acknowledgments
This image is the copyrighted work of the attributed author or publisher, and
ZFIN has permission only to display this image to its users.
Additional permissions should be obtained from the applicable author or publisher of the image.
Full text @ Heliyon

