IMAGE

Figure 2.

ID
ZDB-IMAGE-240509-72
Source
Figures for Cordero et al., 2024
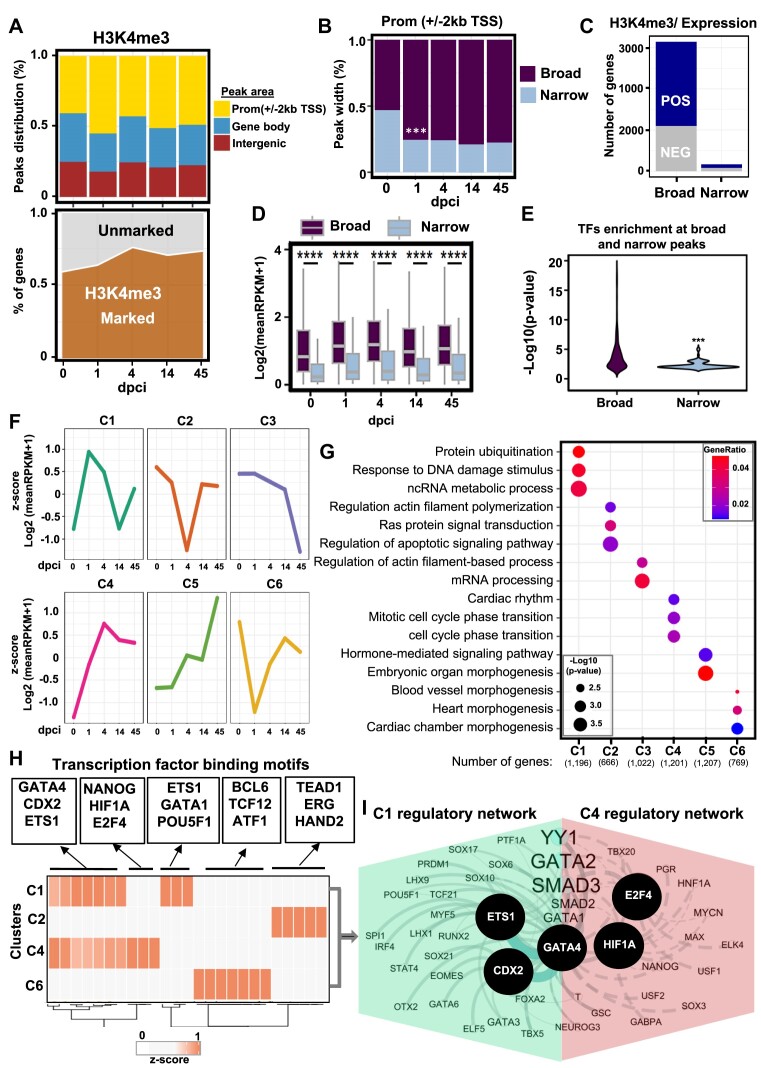
Image
Figure Caption

Figure 2.

H3K4me3 breadth correlates with transcriptional activity in zebrafish heart regeneration. (A) Distribution of H3K4me3 peaks at the promoter (TSS ± 2 kb) (yellow), genebody (TSS > 2 kb) (blue), and intergenic regions (maroon) (top panel). Values are the percentage of each region at each time point. Density plot showing the percentage of genes associated with H3K4me3 peaks (bottom panel). Values are the percentage of marked genes (dark brown) with at least one peak of H3K4me3. (B) Stacked bar plot showing the breadth of H3K4me3 peaks at different time points after heart injury. Broad peaks (>0.5 kb; top 50%) (dark violet), and narrow peaks (<0.5 kb; bottom 50%) (light blue). P-values **P < 0.001 calculated after Fisher's exact test. (C) Percentage of genes characterized by broad and narrow H3K4me3 peaks, positively or negatively correlating to the expression of the neighboring gene, after Spearman's rank correlation. (D) Boxplot showing the expression of genes associated with H3K4me3 peaks, separated by the broadness of the H3K4me3 peak. Values are the log2 from the mean of reads per kilobase million (RPKM)+1. (E) Violin plot showing the transformed log10 from the p-value after hypergeometric test of findMotifsGenome.pl from Homer over the background. (F) Unsupervised k-means clustering of the normalized enrichment of H3K4me3 at broad peaks correlating with gene expression. Correlation after Spearman′s rank test correlation (rho ≤ -0.3 or rho ≥ 0.3 and P-value < 0.35). Values are the z-score from the log2 of the mean of RPKM + 1. (G) Dot plots displaying the representative gene ontology (GO) terms of genes associated with H3K4me3 peaks in the different clusters. P-value was determined by enrichGO from clusterprofiler after ORA test. (H) Heatmap showing enriched TF motifs in the selected clusters. The associated factors were selected according to the workflow presented in Supplementary Figure S1C. The values represent the z-score of the –log10P-value. (I) Interaction network of TFs enriched in C1 (green) and C4 (pink).

Acknowledgments
This image is the copyrighted work of the attributed author or publisher, and ZFIN has permission only to display this image to its users. Additional permissions should be obtained from the applicable author or publisher of the image. Full text @ Nucleic Acids Res.