IMAGE

Fig. 1

ID
ZDB-IMAGE-240509-48
Source
Figures for Kretov et al., 2024
Image
Figure Caption

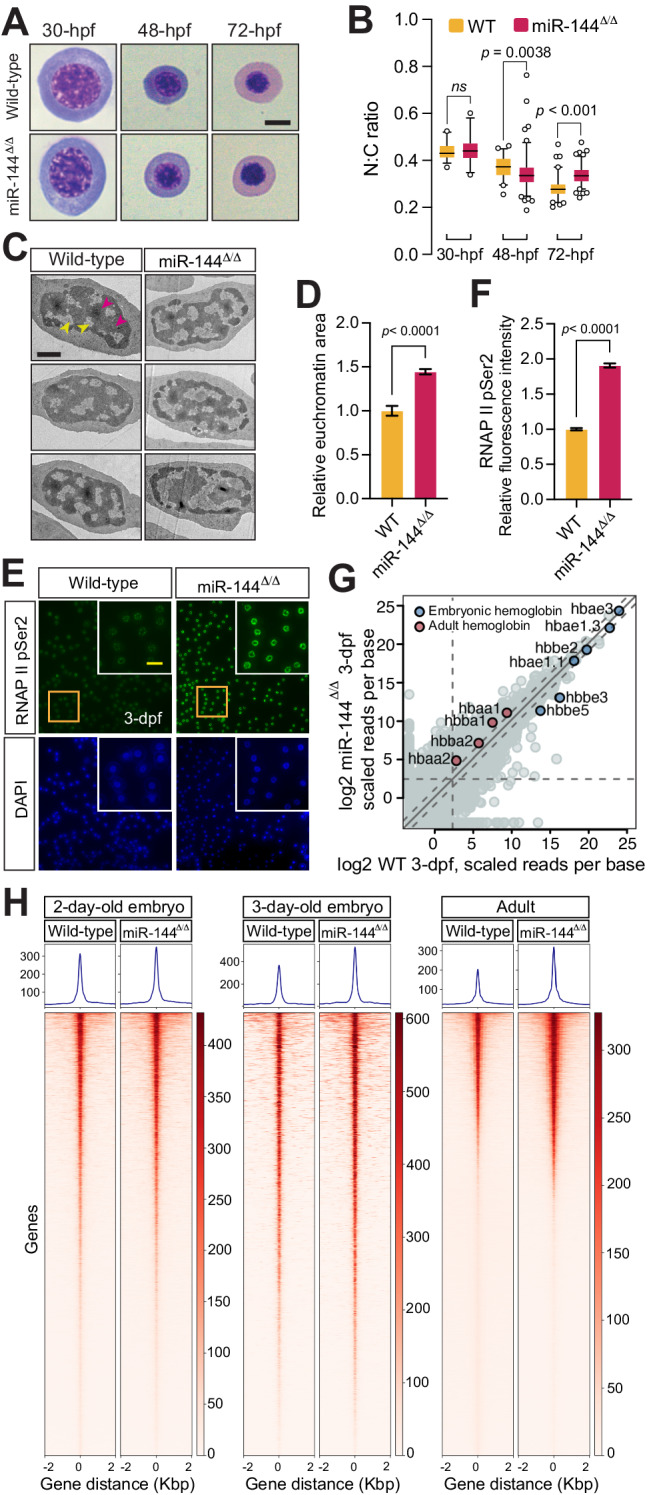
Fig. 1 Loss of miR-144 impairs chromatin condensation during erythropoiesis.

A May–Grünwald–Giemsa staining of peripheral blood cells isolated from miR-144Δ/Δ and wild-type siblings at 30-hpf, 48-hpf, and 72-hpf. Scale bar indicates 5 µm in length. B Quantitative analysis of nucleus-to-cytoplasm area ratio of erythrocytes stained in (A). Individual cells from the pooled blood of ~100 embryos, which in turn are the mixed offspring of multiple breeding pairs are analyzed in each case (wild-type: n = 32, n = 51, and n = 81 cells; miR-144Δ/Δ: n = 26, n = 113, and n = 108 cells, respectively at 30, 48, and 72-hpf). P values from one-way ANOVA test. Boxes enclose data between the 25th and 75th percentile, with horizontal bar indicating the median. Whiskers enclose 5th to 95th percentiles. C Transmission Electron Microscopy of erythrocytes isolated from 3-dpf embryos (yellow arrows indicate euchromatin and magenta indicate heterochromatin). Scale bar indicates 1 µm in length. D Quantification of euchromatic regions of the nuclei from (C). n = 31 cells from wild-type and n = 29 cells from miR-144Δ/Δ mutant cells derived from a pool of bled embryos are analyzed in each case. P value from two-tailed unpaired t test equals P < 0.0001. Error bars represent standard error of the mean. E Immunofluorescent staining of erythrocytes isolated from 3-dpf embryos with anti-RNAP II Ser2 antibodies. Scale bar indicates 10 µm in length. Data representative of three independent experiments. F Quantification of the nuclear signal of RNAP II Ser2 from (E). n = 100 cells are analyzed from each genotype. P values from two-tailed unpaired t test equals P < 0.0001. Error bars represent standard error of the mean. H Heatmaps of ATAC-seq analysis of erythrocytes isolated from peripheral blood 2-dpf, 3-dpf, and adult miR-144Δ/Δ fish and wild-type siblings. 2-dpf and adult samples are analyzed in triplicates, and 3-dpf samples in duplicates. G RNA Sequencing of erythrocytes isolated from 3-dpf. Average of two biological replicates is plotted. Expression of adult and embryonic globins is shown.

Acknowledgments
This image is the copyrighted work of the attributed author or publisher, and ZFIN has permission only to display this image to its users. Additional permissions should be obtained from the applicable author or publisher of the image. Full text @ Nat. Commun.