
|
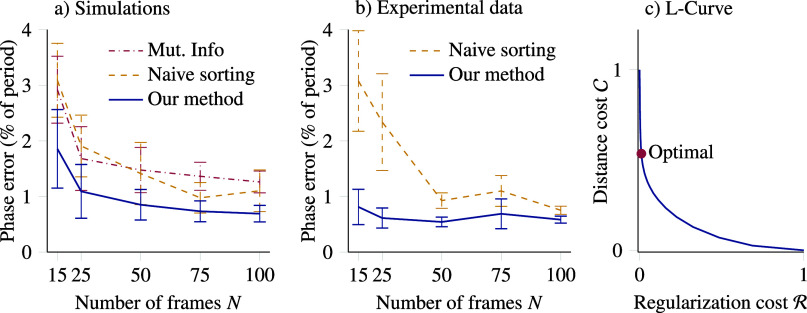
Fig. 6 Quantitative results on synthetic and experimental data. Error bars are 68% confidence intervals computed over 10 repetitions. (a) On synthetic data, our method yields a relative precision improvement of 30% over competing methods, independently of the number of frames acquired. (b) On experimental data, our method performs similarly, with a relative precision improvement of up to 50% (for An external file that holds a picture, illustration, etc. Object name is S2633903X23000223_inline211.jpg ). (c) We choose the regularization strength for phase estimation using an L-curve, emphasizing the regularization cost due to strong priors.