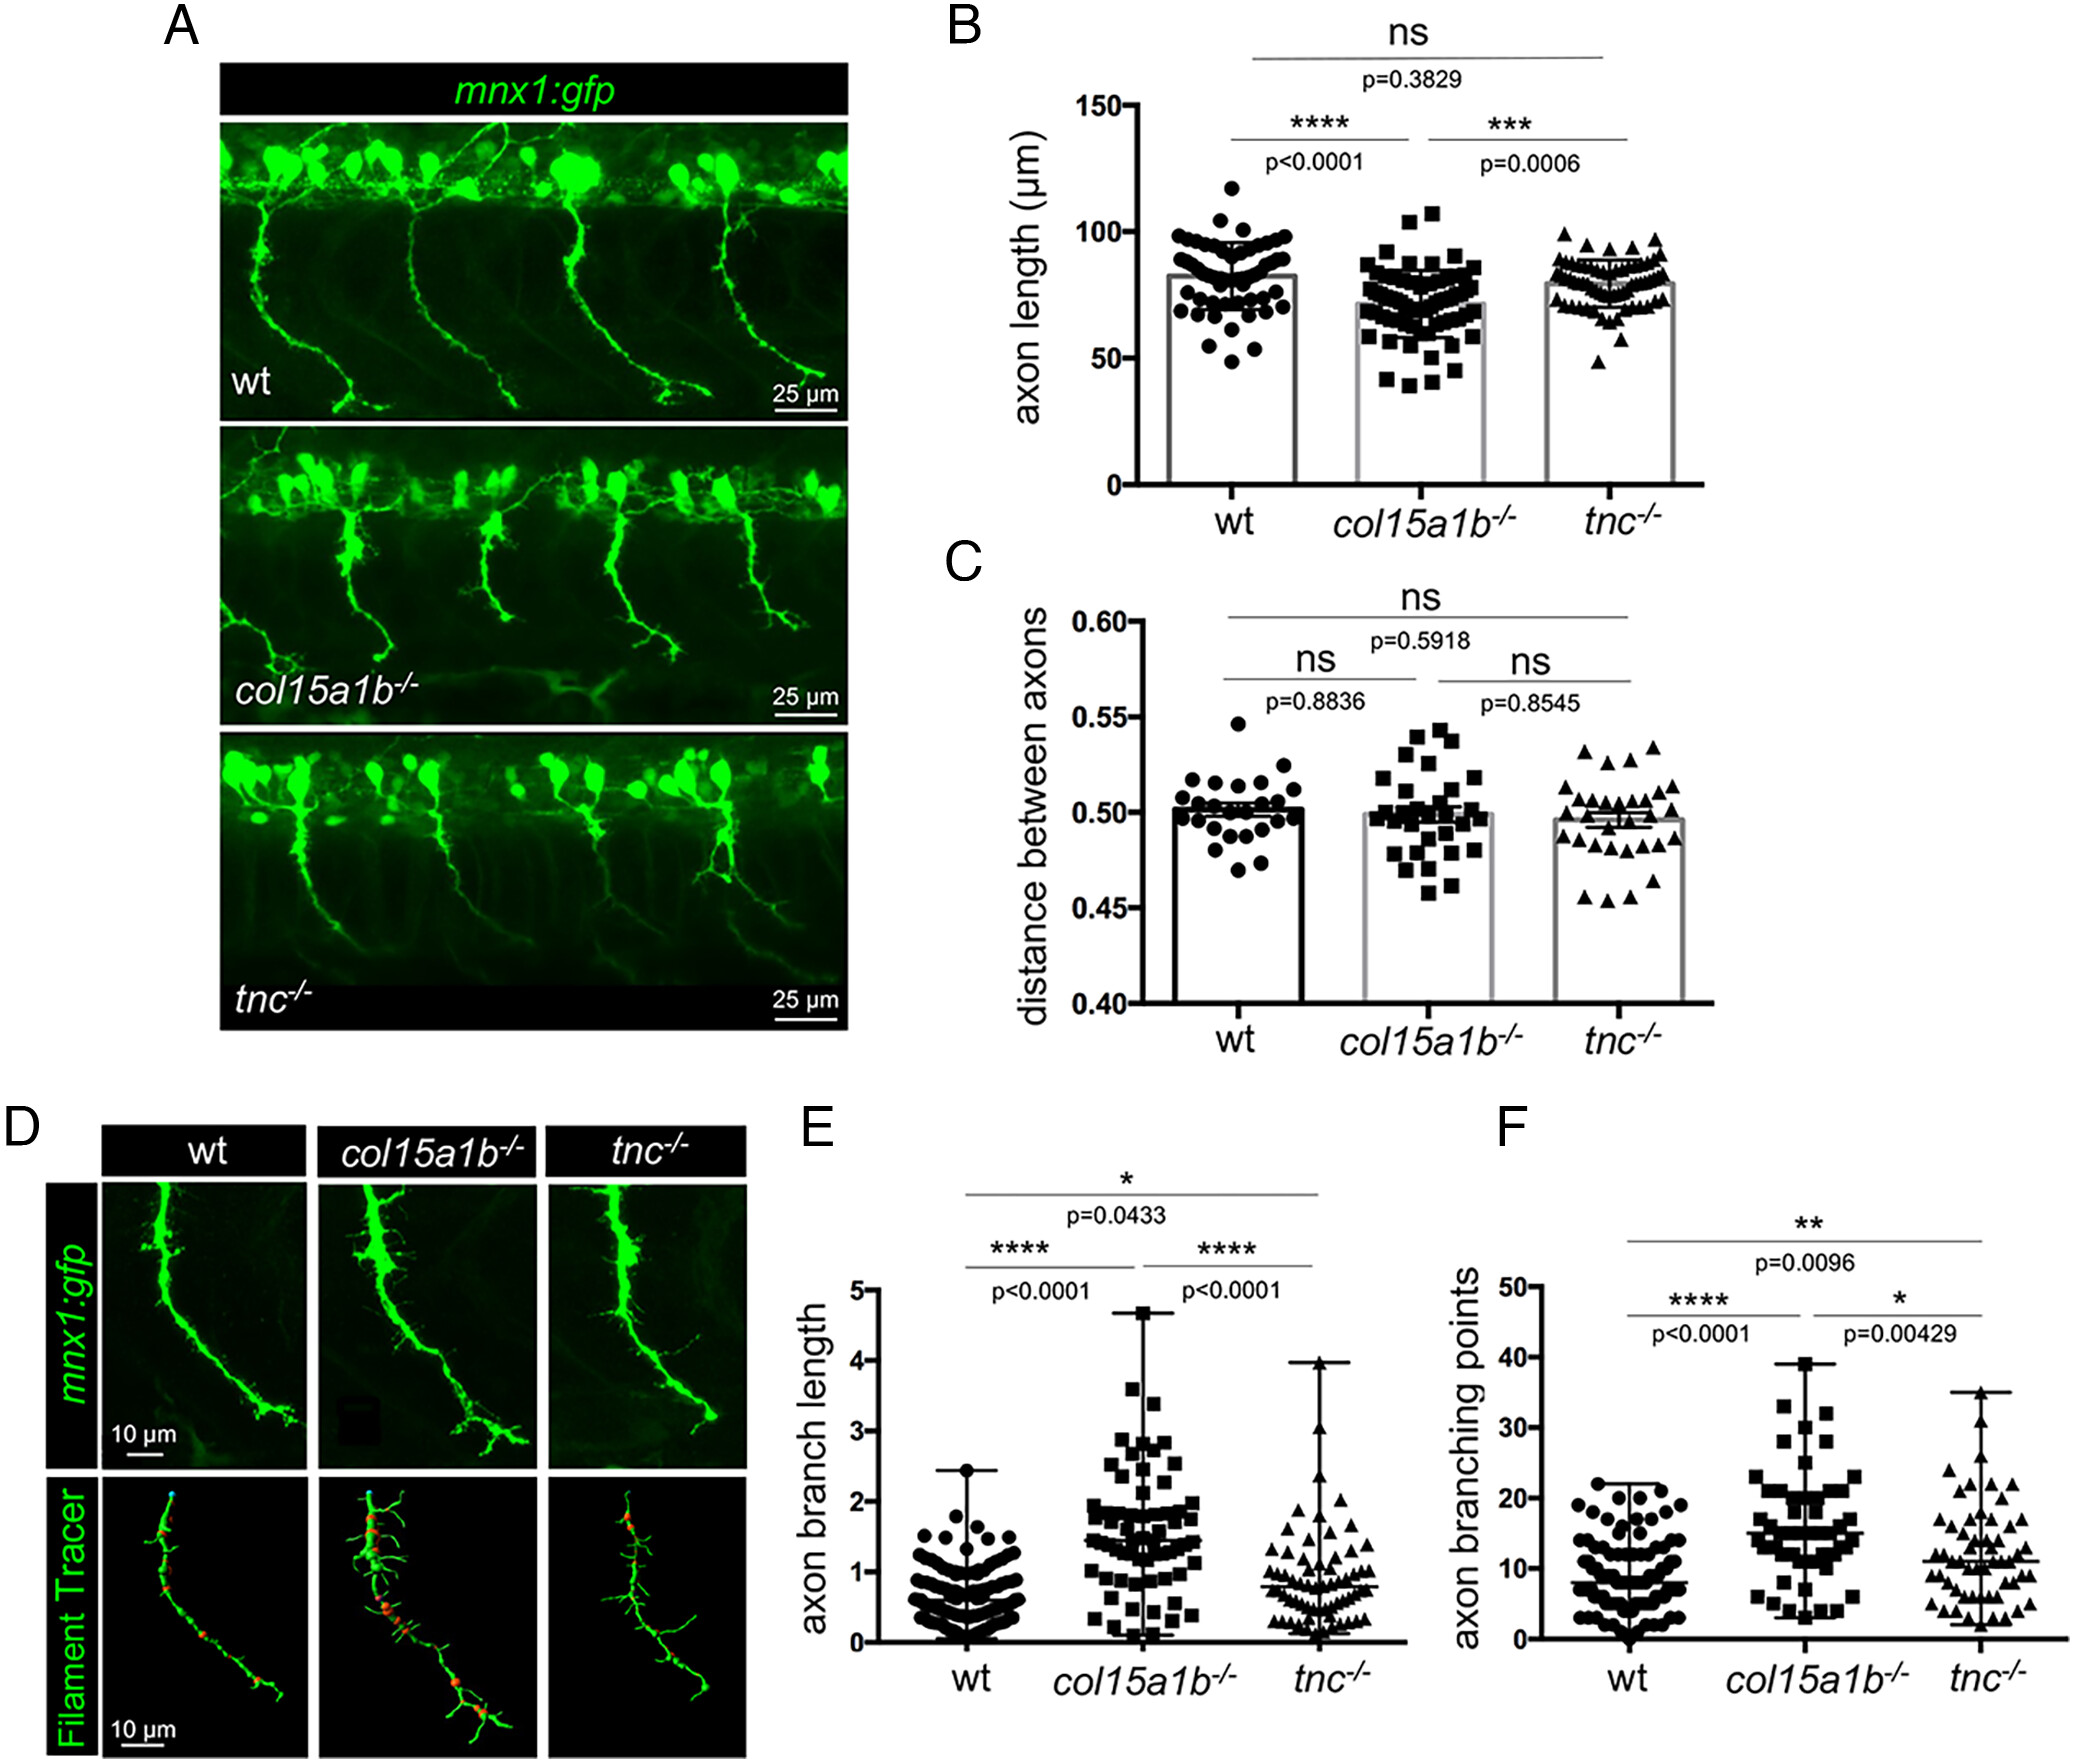
Fig. 5 col15a1b−/− and tnc−/− embryos both display abnormal extrabranching phenotype. (A) whole-mount immunofluorescence of 27 hpf wild-type, col15a1b−/−, and tnc−/− mutant embryos with gfp antibodies (motor neurons, green). (B) Quantification of the axon length, nwt = 11 embryos, 55 axons, ncol15a1b−/− = 13 embryos, 65 axons, ntnc−/− = 13 embryos, 64 axons; (C) Distance between axons normalized to the distance between the two adjacent somites (in µm), nwt = 9 embryos, 25 somites, ncol15a1b−/− = 10 embryos, 31 somites, ntnc−/− = 10 embryos, 31 somites. Statistical analyses in B and C were performed using Tukey’s multiple comparisons test. Mean and SD are presented. (D) Whole-mount immunostaining of 27 hpf wt, tnc−/− and col15a1b−/− mutant embryos with anti-GFP to visualize individual motor axons (green) and their corresponding 3D representation using filament tracer (Imaris software). (E) Quantification of branching length normalized to axon length, nwt = 24 embryos, 118 axons, ncol15a1b−/− = 13 embryos, 64 axons, ntnc−/− = 13 embryos, 64 axons (F) branching point normalized to axon length, nwt = 21 embryos, 97 axons, ncol15a1b−/− = 13 embryos, 54 axons, ntnc−/− = 13 embryos, 56 axons. (E and F) Statistical analyses were performed using Kruskal–Wallis and Dunn’s multiple comparisons tests, median and range are represented. In all graphs, each point represents one motor axon. ns, not significant; *P < 0.05, **P < 0.01, ***P < 0.001, ****P < 0.0001. All embryos are lateral views; anterior is left.
Image
Figure Caption
Figure Data
Acknowledgments
This image is the copyrighted work of the attributed author or publisher, and
ZFIN has permission only to display this image to its users.
Additional permissions should be obtained from the applicable author or publisher of the image.
Full text @ Proc. Natl. Acad. Sci. USA

