
Fig. 2
- ID
- ZDB-IMAGE-240508-2
- Publication
- Nemoz-Billet et al., 2024 - Dual topologies of myotomal collagen XV and Tenascin C act in concert to guide and shape developing motor axons
- All Figures
- Figures for Nemoz-Billet et al., 2024
|
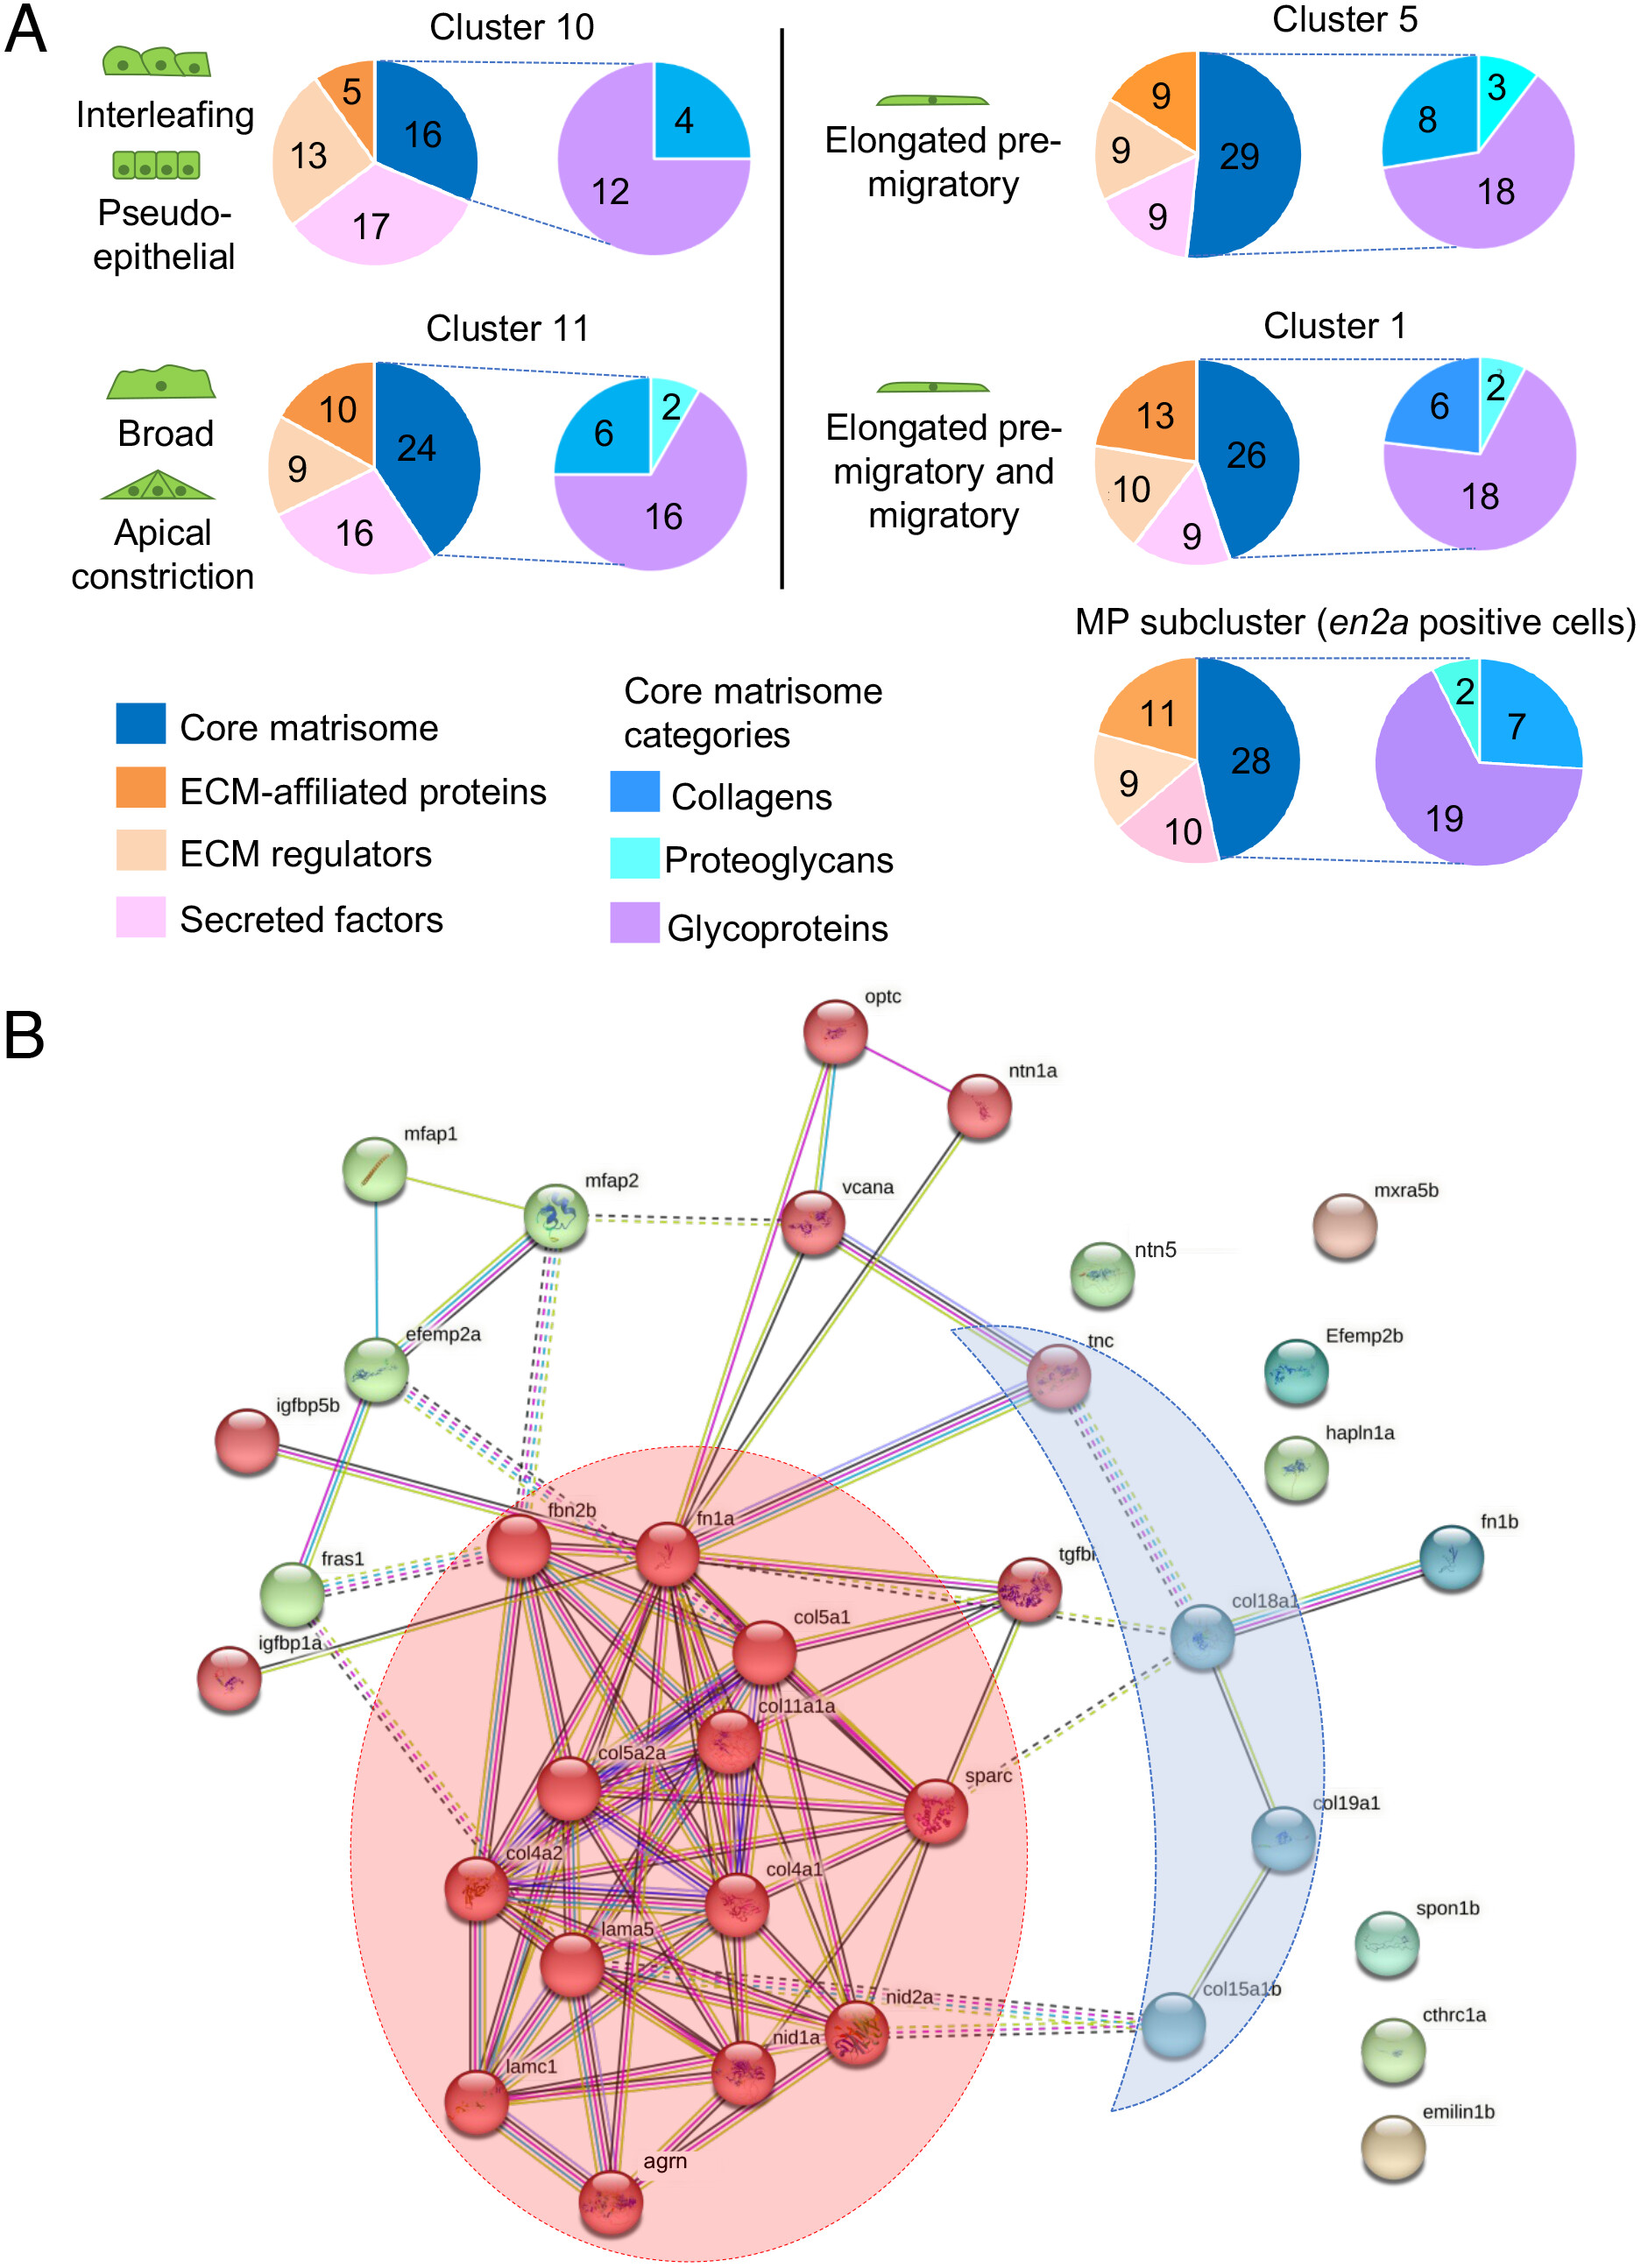
Fig. 2 Characterization of differentiating SMP matrisomes. (A) Left pie charts represent the number of matrisome genes expressed in each cluster and classified by categories, Right pie charts represent the number of core-matrisome genes expressed in each cluster and by subcategories. (B) Protein–protein interaction network analysis of the total core matrisome genes expressed by SMPs with STRING database. The protein interaction network of the 36 core-matrisome genes was created with an enrichment P-value <10−16. Clusters were generated using a MCL inflation parameter of 2. One color represents one cluster. Two hubs of interest are highlighted: BM-toolkit (red) and BM-associated genes (blue).