IMAGE

Fig. 5

ID
ZDB-IMAGE-240501-14
Source
Figures for Cardeira-da-Silva et al., 2024
Image
Figure Caption

Fig. 5 
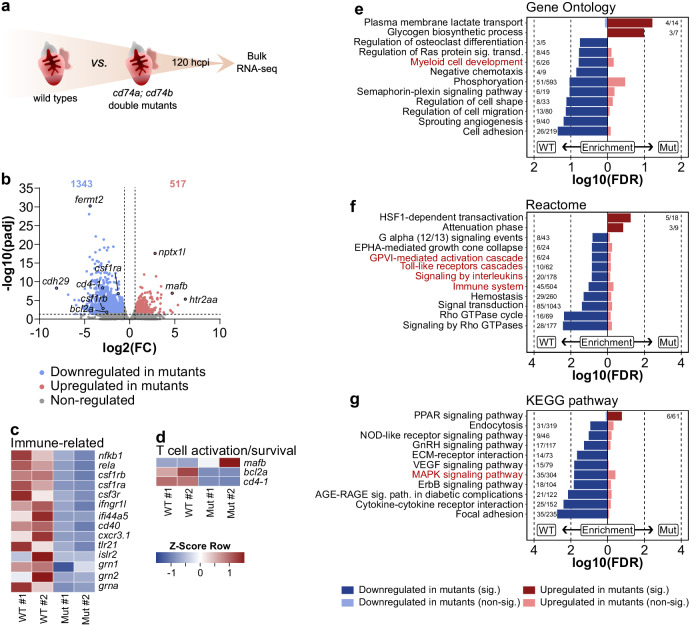
The immune response is hampered in cd74a; cd74b mutants.

a Experimental design for bulk RNA-seq analysis of injured ventricles from wild types and cd74a; cd74b mutants at 120 hpci. b Volcano plot showing differentially expressed genes (FC ≥ 2; FDR < 0.05). Blue and red dots represent genes down- and upregulated, respectively, in cd74a; cd74b mutants compared with wild types. Blue and red values represent the number of significantly down- and upregulated genes, respectively; Wald test, corrected for multiple testing using the Benjamini-Hochberg method. c, d Heat maps showing the relative expression of genes encoding known immune-related factors (c), and proteins involved in T cell activation and survival (d) in individual samples. eg Gene enrichment analyses showing significantly regulated Gene Ontology terms (e), Reactome (f) and KEGG pathways; immune-related processes and pathways marked in red. FDR false discovery rate, FC fold change, WT wild-type samples, Mut cd74a; cd74b mutant samples.

Acknowledgments
This image is the copyrighted work of the attributed author or publisher, and ZFIN has permission only to display this image to its users. Additional permissions should be obtained from the applicable author or publisher of the image. Full text @ Nat. Commun.