IMAGE

Fig. 4

ID
ZDB-IMAGE-240501-13
Source
Figures for Cardeira-da-Silva et al., 2024
Image
Figure Caption

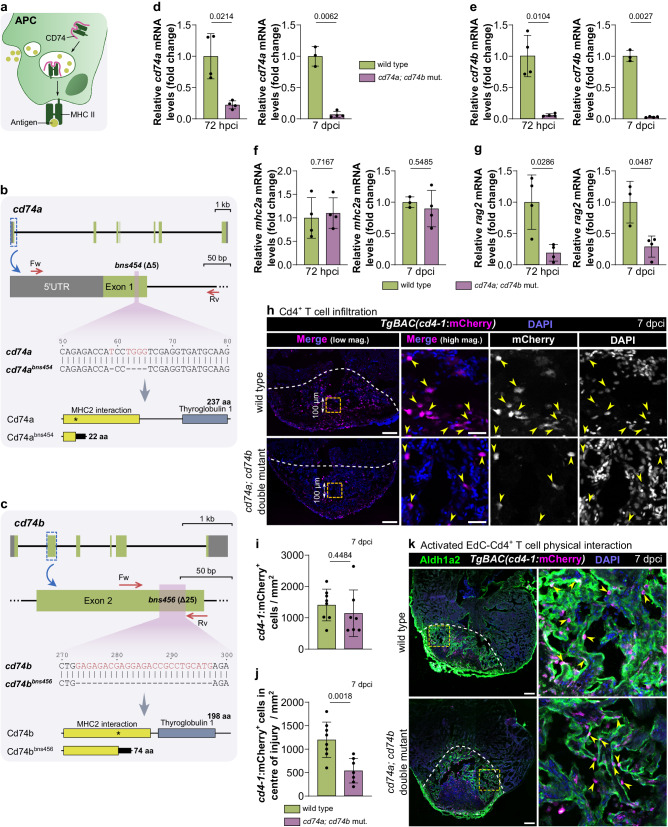
Fig. 4 cd74a; cd74b mutants exhibit reduced Cd4+ T cell infiltration of the injured cardiac tissue.

a Schematic showing the involvement of CD74 in MHC class II antigen presentation. b, c Schematics of the cd74a (b) and cd74b (c) wild-type and mutant alleles (bns454 and bns456) depicting the wild-type gene structure, location of the mutations, primers used for genotyping, nucleotide deletions (red) and the predicted resulting proteins, highlighting the different domains. The numbers mark the nucleotide positions in the respective coding sequences. Asterisks mark the mutation site. dg Relative mRNA levels of cd74a (d), cd74b (e), the antigen presentation gene mhc2a (f) and the lymphoid gene rag2 (g) in wild-type and cd74a; cd74b mutant ventricles at 72 hpci and 7 dpci. Ct values included in Supplementary Table 7. h Confocal images of representative cryosectioned ventricles from adult TgBAC(cd4-1:mCherry) wild-type and cd74a; cd74b mutant zebrafish at 7 dpci, immunostained for mCherry, showing a reduction in the infiltration of Cd4+ T cells (yellow arrowheads) in the central part of the injured tissue in double mutants; yellow dashed squares outline the magnified areas shown on the right and these areas were used to quantify the data depicted in j; dashed lines mark the border of the injured tissue. i, j Quantification of total cd4-1:mCherry+ cells within the whole (i) or central (j) region of the injured tissue of wild types and cd74a; cd74b mutants. Dots in the graphs represent individual ventricles, and the bars represent the mean ± SD; n = 4 (wild type and cd74a; cd74b mut.) biologically independent samples for 72 hpci and 3 (wild type) and 4 (cd74a; cd74b mut.) for 7 dpci in dg, and 8 (wild type) and 7 (cd74a; cd74b mut.) biologically independent samples in i, j; two-tailed Welch’s t test (P values included in the graphs). k Confocal images of representative cryosectioned ventricles from adult TgBAC(cd4-1:mCherry) wild-type and cd74a; cd74b mutant zebrafish at 7 dpci, immunostained for mCherry and Aldh1a2, showing apparently unchanged physical proximity between activated EdCs and Cd4+ T cells. Scale bars: 100 µm (low magnification); 20 µm (high magnification). Green and gray boxes in b and c represent exons and UTRs, respectively. aa amino acids, MHC II Major Histocompatibility Complex Class II, Fw forward primer, Rv reverse primer, kb kilobase pairs, bp base pairs.

Acknowledgments
This image is the copyrighted work of the attributed author or publisher, and ZFIN has permission only to display this image to its users. Additional permissions should be obtained from the applicable author or publisher of the image. Full text @ Nat. Commun.