IMAGE

Fig. 2

ID
ZDB-IMAGE-240501-11
Source
Figures for Cardeira-da-Silva et al., 2024
Image
Figure Caption

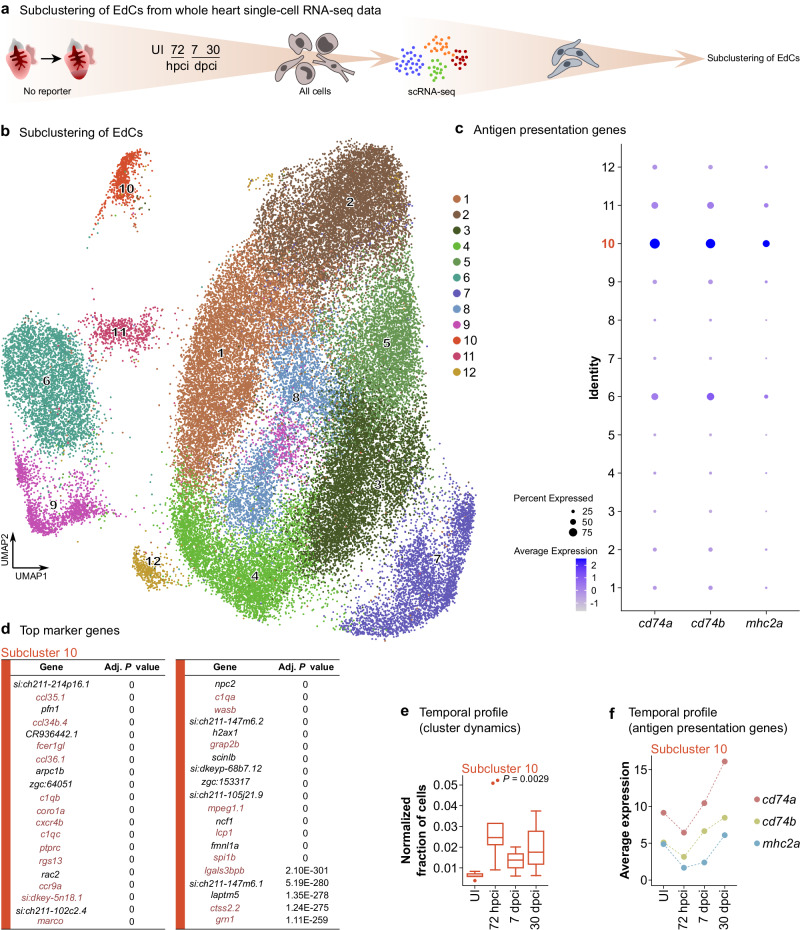
Fig. 2 One endocardial cell subcluster exhibits an antigen presentation and immune-like transcriptome.

a Experimental design for subclustering analysis of EdCs from a published scRNA-seq dataset of the whole regenerating zebrafish heart43. b UMAP plot showing 12 different EdC subclusters. c Dot plot showing enriched expression of antigen presentation genes in at least subcluster 10. d List of top 40 marker genes in subcluster 10, showing strong enrichment in immune-related genes (red). Wilcoxon Rank Sum Test; adjusted P value based on Bonferroni correction. e Box plot showing the increased relative abundance of cells in subcluster 10 during regeneration compared with uninjured; box plot represents the median, Q1, Q3, the minimum, and the maximum; dots represent potential outliers; n = 5, 10, 13, 5 independent datasets for UI, 72 hpci, and 7 and 14 dpci, respectively (see43); one-way ANOVA (P value included in the graph). f Plot showing the average expression of antigen presentation genes within subcluster 10 at different time points, revealing increased levels during regeneration. UI uninjured.

Acknowledgments
This image is the copyrighted work of the attributed author or publisher, and ZFIN has permission only to display this image to its users. Additional permissions should be obtained from the applicable author or publisher of the image. Full text @ Nat. Commun.