IMAGE

Fig. 1

ID
ZDB-IMAGE-240501-10
Source
Figures for Cardeira-da-Silva et al., 2024
Image
Figure Caption

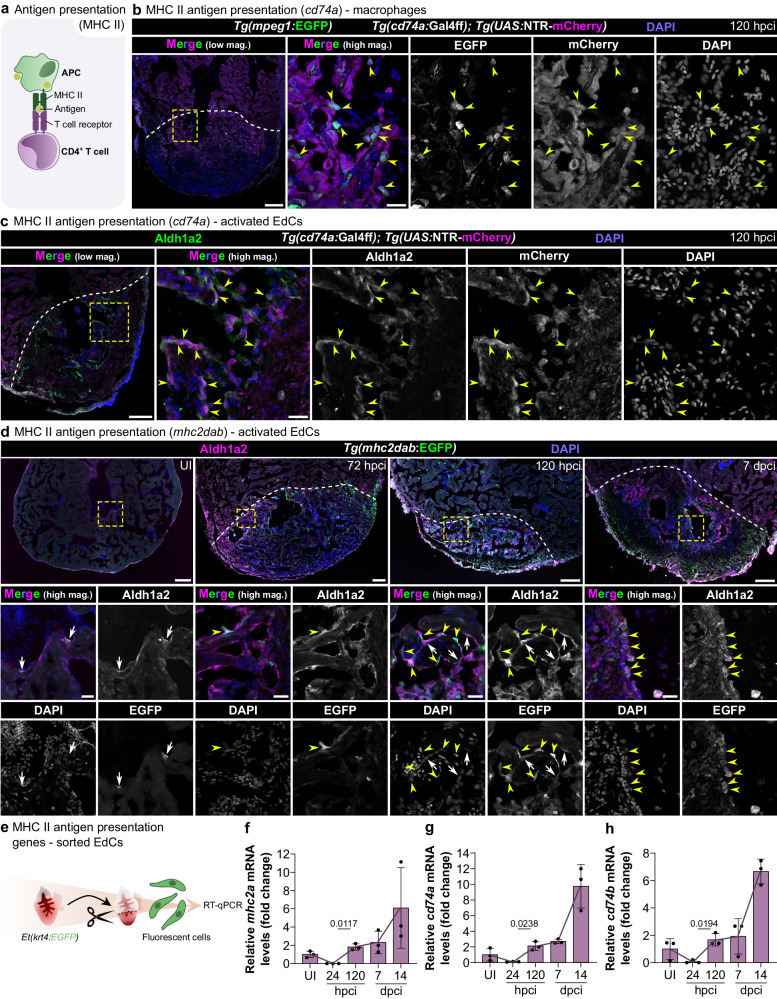
Fig. 1 Antigen presentation genes are activated in leukocytes and endocardial cells during zebrafish cardiac regeneration.

a Schematic illustration of the classical model of MHC class II antigen presentation and the activation of CD4+ T cells. b Confocal images of a cryosectioned ventricle from an adult Tg(cd74a:Gal4ff); Tg(UAS:NTR-mCherry); Tg(mpeg1:EGFP) zebrafish at 120 hpci, immunostained for mCherry and EGFP, showing cd74a:mCherry expression in macrophages (yellow arrowheads); two independent experiments with similar results. c Confocal images of a cryosectioned ventricle from an adult Tg(cd74a:Gal4ff); Tg(UAS:NTR-mCherry) zebrafish at 120 hpci, immunostained for mCherry and Aldh1a2, showing cd74a:mCherry expression also in activated EdCs (yellow arrowheads); two independent experiments with similar results. d Confocal images of cryosectioned ventricles from Tg(mhc2dab:EGFP) uninjured adult zebrafish and at various time points after cryoinjury, immunostained for EGFP and Aldh1a2, showing transgene expression in activated EdCs (yellow arrowheads, EGFPhigh; white arrows, EGFPlow), especially starting at 120 hpci; two independent experiments with similar results. eh Experimental design (e) and graphs showing the relative mRNA levels of the antigen presentation genes mhc2a (f), cd74a (g), and cd74b (h) in the absence of injury and at various time points after injury in sorted Et(krt4:EGFP)+ EdCs, revealing an initial decrease in expression upon cryoinjury followed by an increase starting at 120 hpci. Dots in the graphs represent individual ventricles, and the bars represent the mean ± SD; n = 3 biologically independent samples for all time points; two-tailed Welch’s t test between 72 and 120 hpci (P values included in the graphs); Ct values included in Supplementary Table 6. Yellow dashed rectangles and squares outline the magnified areas; dashed lines mark the border of the injured tissue. Scale bars: 100 µm (low magnification); 20 µm (high magnification). UI uninjured, APC antigen-presenting cell, MHC II major histocompatibility complex class II.

Acknowledgments
This image is the copyrighted work of the attributed author or publisher, and ZFIN has permission only to display this image to its users. Additional permissions should be obtained from the applicable author or publisher of the image. Full text @ Nat. Commun.