
IMAGE

FIGURE 4

ID
ZDB-IMAGE-240430-49
Publication
González-Llera et al., 2023 - An in vivo drug screen in zebrafish reveals that cyclooxygenase 2-derived prostaglandin D2 promotes spinal cord neurogenesis
All Figures
Figures for González-Llera et al., 2023
Image
Figure Caption

FIGURE 4

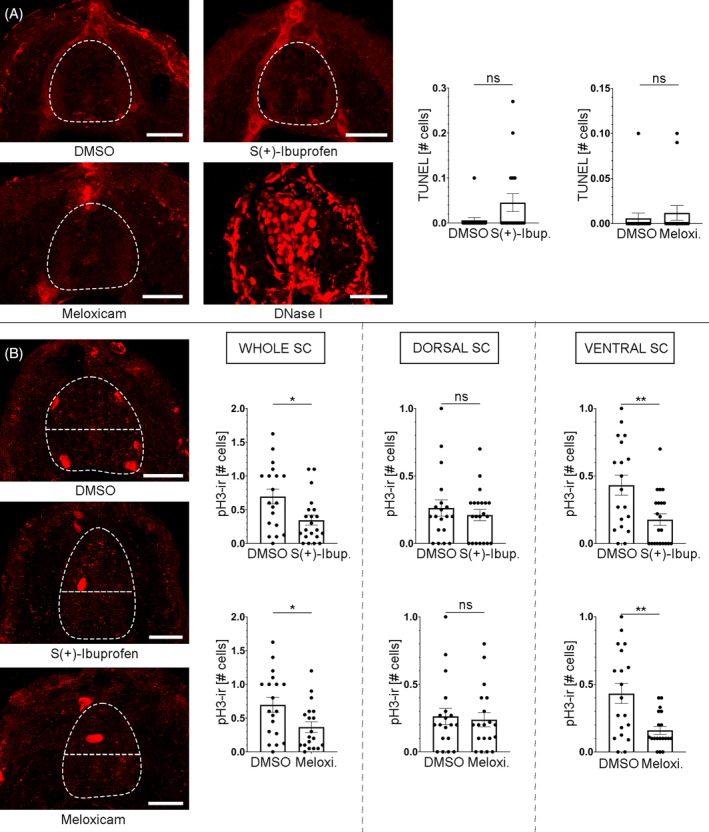
PG signalling promotes mitotic activity in the developing spinal cord of 3 dpf zebrafish. (A) Treatments with the COX inhibitors S(+)‐Ibuprofen (0.046 ± 0.02 cells, n = 17; Mann–Whitney test; p‐value = 0.1227) and Meloxicam (0.012 ± 0.008 cells, n = 16; Mann–Whitney test; p‐value = 0.7341) did not significantly changed the number of TUNEL positive (apoptotic) cells in the spinal cord as compared to DMSO controls (0.006 ± 0.006 cells, n = 17). Note the clear TUNEL positive nuclei in a DNase I positive control spinal cord section. (B) Treatments with the COX inhibitors S(+)‐Ibuprofen (0.345 ± 0.074 cells, n = 21; Unpaired t‐test; p‐value = 0.0107) and Meloxicam (0.367 ± 0.078 cells, n = 19; Unpaired t‐test; p‐value = 0.0199) significantly changed the number of pH 3+ positive (mitotic) cells in the whole spinal cord (SC) as compared to DMSO controls (0.695 ± 0.11 cells, n = 19). Treatments with the COX inhibitors S(+)‐Ibuprofen (0.210 ± 0.041 cells, n = 21; Mann–Whitney test; p‐value = 0.9402) and Meloxicam (0.238 ± 0.053 cells, n = 29; Mann–Whitney test; p‐value = 0.8211) did not significantly changed the number of pH 3+ positive cells in the dorsal spinal cord as compared to DMSO controls (0.263 ± 0.060 cells, n = 19). Treatments with the COX inhibitors S(+)‐Ibuprofen (0.177 ± 0.043 cells, n = 21; Unpaired t‐test; p‐value = 0.0042) and Meloxicam (0.16 ± 0.029 cells, n = 29; Unpaired t‐test; p‐value = 0.0016) significantly changed the number of pH 3+ positive cells in the ventral spinal cord as compared to DMSO controls (0.432 ± 0.074 cells, n = 19). Dorsal is to the top in all photomicrographs of the larval transverse sections. The dashed lines indicate the border of the spinal cord in (A) and (B) and, also the separation between the ventral and dorsal portions of the spinal cord in (B). Scale bars: 20 μm.

Acknowledgments
This image is the copyrighted work of the attributed author or publisher, and ZFIN has permission only to display this image to its users. Additional permissions should be obtained from the applicable author or publisher of the image. Full text @ Cell Prolif.