
|
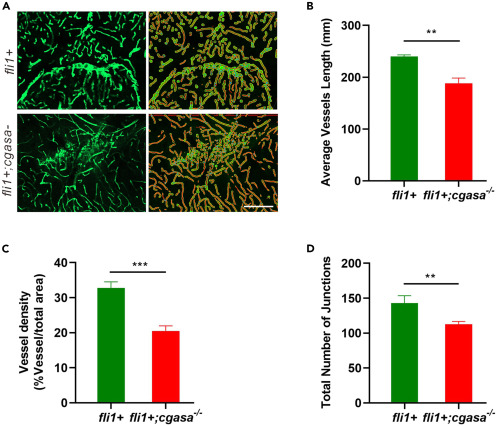
Fig. 7 AngioTool was used to analyze brain cortical vasculature formation in Tg(fli1a:eGFP);cgasa−/− and Tg(fli1a:eGFP) fish lines (A) Representative images of brain cortical vasculature in 3-month-old Tg(fli1a:eGFP);cgasa−/− and Tg(fli1a:eGFP) fish. Scale bar, 50 μm. (B–D) Quantitative analyses of average vessel length (B), vessel density (C), and total number of junctions (D) in brain cortices from 3-month-old Tg(fli1a:eGFP);cgasa−/− and Tg(fli1a:eGFP) fish lines. Data are represented as Student’s t-test. ∗∗p < 0.01; ∗∗∗p < 0.001. fli+, Tg(fli1a:eGFP) homozygote; fli1;cgasa−/−, Tg(fli1a:eGFP);cgasa−/− homozygote.