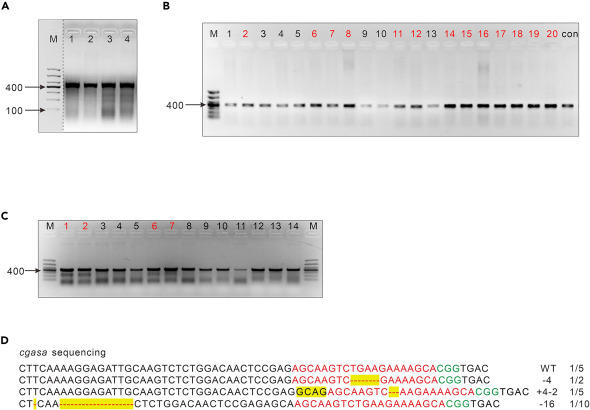
Fig. 3 Genotyping PCR assays (A) Representative image of agarose gel results of the T7EI assay from two repeated experiments. Lanes 1 and 2 are from the control group (wild-type embryos) after T7EI digestion, whereas Lanes 3 and 4 are from the injected group after T7EI digestion. As denoted by the broken line, unrelated outcomes on the gel were excluded from the retained results on the gel. (B) Representative image of an agarose gel resulting from the identification of positive colonies (n = 20). The samples with stronger signals (n = 13; marked in red) will be analyzed by the following T7EI assay. M, Marker; con, control group. (C) Representative image of the T7EI assay in (B). The samples with stronger signals (n = 4; marked in red), which indicate potential positive mutations, will be analyzed by DNA sequencing. Lanes 1–13 are from the identified samples in (B), and Lane 14 is from the control (wild-type embryos). (D) The alignment between the mutant sequence of the cgasa gene from the individual selected colony and the wild-type sequence of the cgasa gene in zebrafish. Red, the CRISPR target sequences; green, PAM; yellow, mutations.
Image
Figure Caption
Acknowledgments
This image is the copyrighted work of the attributed author or publisher, and
ZFIN has permission only to display this image to its users.
Additional permissions should be obtained from the applicable author or publisher of the image.
Full text @ STAR Protoc

