
Image
|
Figure Caption
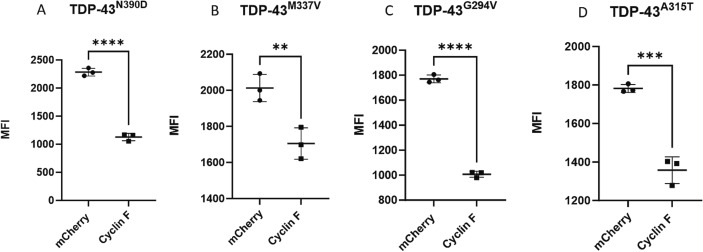
Fig. 2 Cyclin F depleted multiple TDP-43 variants. Flow cytometry analysis of cyclin F effect on protein levels of: A. TDP-43N390D, B. TDP-43M337V, C. TDP-43G294V and D. TDP-43A315T. All data represent the GFP Mean Fluorescent Intensity (MFI) along with SD in mCherry expressing cells analysed by flow cytometry. N = 3. A Student's t-test was performed to determine significance. **p ≤ 0.01. ***p ≤ 0.001, ****p ≤ 0.0001, ns; not significant.
Acknowledgments
This image is the copyrighted work of the attributed author or publisher, and
ZFIN has permission only to display this image to its users.
Additional permissions should be obtained from the applicable author or publisher of the image.
Full text @ Neurobiol. Dis.