
Fig. 1
- ID
- ZDB-IMAGE-240423-4
- Publication
- Rao et al., 2024 - Myoglobin modulates the Hippo pathway to promote cardiomyocyte differentiation
- All Figures
- Figures for Rao et al., 2024
|
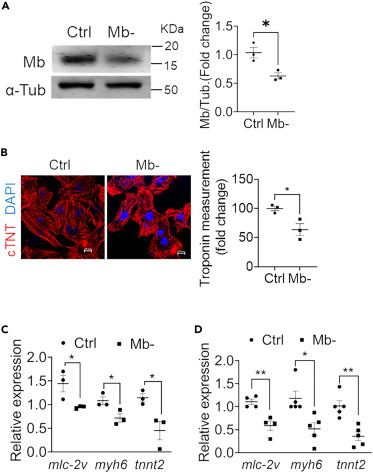
Fig. 1 Deletion of endogenous myoglobin inhibits cardiomyocyte differentiation (A) Representative western blot and quantification of Mb in NRVMs treated with control (Ctrl) or Mb targeted siRNA (Mb−). N = 3. (B) Representative immunofluorescence images of NRVMs stained for cardiac troponin T (cTNT; red) to visualize sarcomeric structures and DAPI for nuclei (blue). Relative quantification of troponin fiber lengths in Mb− cells relative to control cells. Scale bar: 10 μm. N = 3. (C) Relative mRNA expression of cardiac structural differentiation markers-mlc-2v (myosin light chain), myh6 (myosin heavy chain), tnnt2 (cardiac troponinT)- in NRVM compared to control undifferentiated cells after Mb knockdown. N = 3. (D) Relative mRNA expression levels of cardiac structural differentiation markers in control and Mb− H9C2 cells. N = 4–5. Data are mean ± SEM; ∗p < 0.05, ∗∗p < 0.01.