IMAGE

Fig. 5

ID
ZDB-IMAGE-240422-33
Source
Figures for Zhao et al., 2024
Image
Figure Caption

Fig. 5 
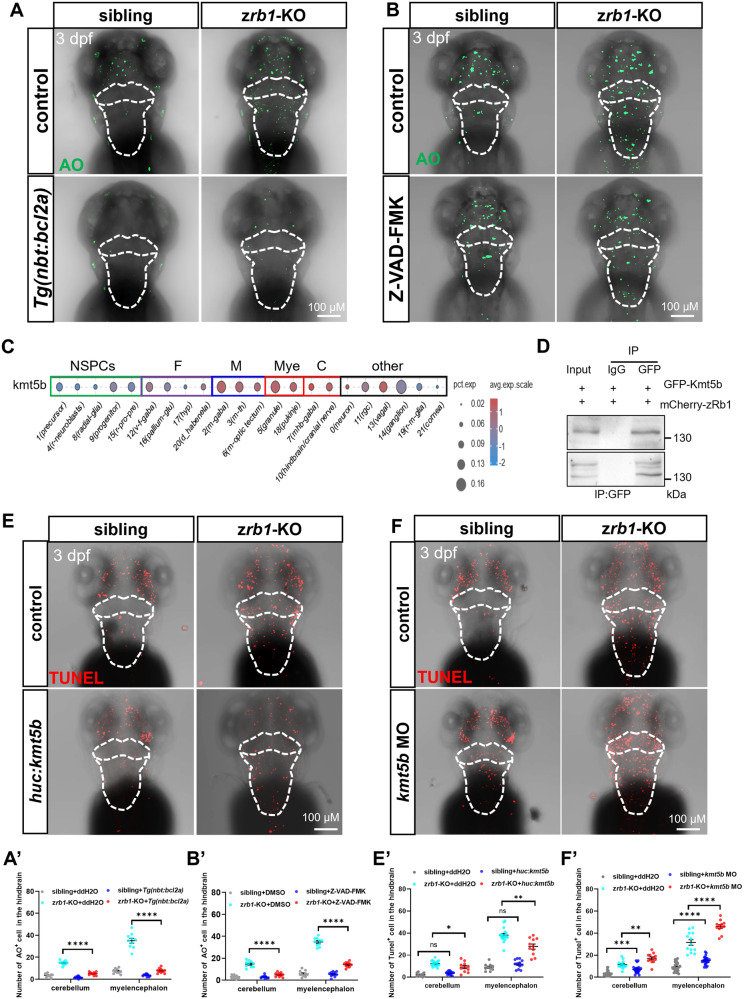
Rb1 regulates post-mitotic neuron apoptosis through the Kmt5b-bcl2a/caspase pathway.

AO staining in the brain at 3 dpf after overexpression of bcl2a in the nervous system (A) or treated Z-VAD-FMK (B) of siblings and zrb1-KO mutants. The white dotted line outlines the cerebellum and myelencephalon. A′, B′ Quantification of AO+ cells in all groups of (A, B) (one-way ANOVA; mean ± SEM; ****P < 0.0001; n = 10). C Dot plot showing the expression levels of kmt5b in six brain regions. The gray level represents the average expression; the dot size represents the percentage of cells expressing the marker genes. D Co-immunoprecipitation (Co-IP) analyses on the interaction between zRb1 and Kmt5b. The GPF–Kmt5b and mCherry-zRb1 plasmids were injected into wild-type zebrafish. Immunoprecipitation was performed with an antibody against GPF (upper panel) and confirmed with reciprocal immunoprecipitation experiments with antibodies against mCherry (lower panel). IgG represents a control antibody used for IPs. Input lanes contain lysate equal to one fifth of the amount used for the pull-down assays. IP indicates the antibody used for immunoprecipitation. TUNEL staining in the brain at 3 dpf after injecting huc:kmt5b-egfp plasmid (E) and kmt5b MO (F) in siblings and zrb1-KO mutants. The white dotted line outlines the cerebellum and myelencephalon. Quantification of TUNEL+ cells of the hindbrain after injecting huc:kmt5b-egfp plasmid (E′) and kmt5b MO (F′) in siblings and zrb1-KO mutants (one-way ANOVA; mean ± SEM; *P < 0.05; **P < 0.01; ****P < 0.0001; n ≥ 10).

Acknowledgments
This image is the copyrighted work of the attributed author or publisher, and ZFIN has permission only to display this image to its users. Additional permissions should be obtained from the applicable author or publisher of the image. Full text @ Cell Death Discov