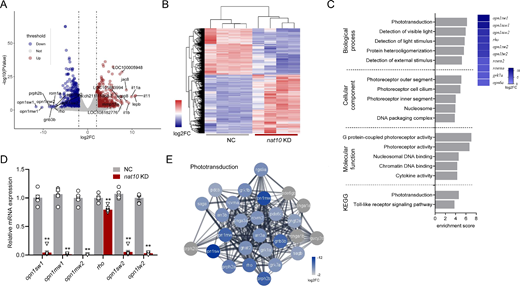
Fig. 8 Transcriptomic profiling of nat10 KD in zebrafish larvae. (A) Volcano plots illustrate the differential gene expression between the NC and the nat10 KD zebrafish larvae. Differentially expressed genes, indicated by P < 0.05 and a log2 fold change (log2FC) ≥2 (downregulated genes in blue, upregulated genes in red, and nonsignificant changes in gray). (B) A hierarchical heatmap shows the differential expression patterns in 4 independent NC and nat10 KD samples, with color intensity indicating fold changes; upregulation and downregulation are marked in red and blue, respectively. (C) Gene Ontology (GO) enrichment analysis for genes differentially expressed in nat10 KD larvae, showing the top 5 GO terms in four categories ranked by enrichment score. The right panel shows a heatmap of genes associated with the phototransduction GO term, with a color scale reflecting log2FC. (D) Quantitative real-time RT-PCR validation of mRNA levels for key differentially expressed genes in phototransduction. Results are presented as mean ± SEM from six independent experiments. Statistical analysis was performed using 1-way ANOVA with the Tukey post hoc test; ***P < 0.001 vs. NC. (E) Construction of a protein-protein interaction network for the phototransduction interactome using STRING database.
Image
Figure Caption
Acknowledgments
This image is the copyrighted work of the attributed author or publisher, and
ZFIN has permission only to display this image to its users.
Additional permissions should be obtained from the applicable author or publisher of the image.
Full text @ Invest. Ophthalmol. Vis. Sci.

