IMAGE

Fig. 7

ID
ZDB-IMAGE-240418-54
Source
Figures for Zhu et al., 2024
Image
Figure Caption

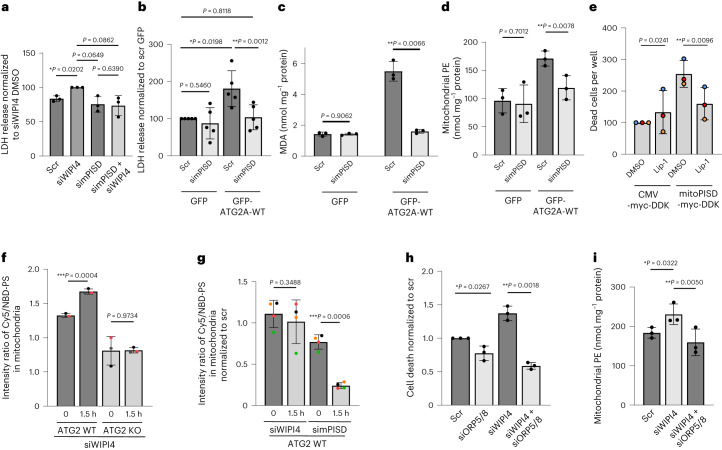
Fig. 7 ATG2 transports PS into mitochondria, which is then locally converted to PE.

a, HeLa cells were transfected with scramble siRNA, siWIPI4 or siRNA targeting mitochondrial PISD-2 (simPISD) for 48 h and the levels of LDH release were measured (n = 3). b, ATG2A/B-KO HeLa cells were transfected with scramble siRNA or simPISD for 48 h before transfection with GFP or GFP–ATG2A constructs for another 24 h. Conditioned media were used for the LDH assay (n = 3). c,d, Cells from b were lysed and assayed for MDA (c) and PE (d). Two-tailed paired Student’s t-test (n = 3). e, Cell death of HeLa cells transfected with CMV-myc-DDK or mitoPISD-myc-DDK (n = 3). The cells were cultured for 24 h before treatment with DMSO or 100 nM Lip-1 in media containing IncuCyte red dye. The samples were imaged 48 h post transfection and dead cells were counted (number of red objects). Data are the average number of dead cells per well normalized to the CMV-myc-DDK-transfected/DMSO-treated control. f, Mitochondrial conversion of 18:1-12:0 NBD-PS to PE within 1.5 h measured by microscopy (n = 3). g, HeLa cells were first treated with Seahorse for 15 min and then treated, imaged and assayed as in f (n = 4). h, Cell death of SH-SY5Y cells transfected with 50 nM siWIPI4 and/or siRNA to ORP5/8 (siORP5/8; n = 3). Cells were stained with CellTox green dye 48 h post transfection. Cell death was determined as the ratio of the green area (dead cells) to the phase area (total cells). i, Levels of PE in the mitochondrial fractions of HeLa cells transfected with the indicated siRNAs (n = 3). Cell fractionation was performed 48 h post transfection and mitochondrial samples with same protein abundance were used for the PE assay. a,b,e,h, Data are the normalized mean ± s.d. Two-tailed one-sample Student’s t-test for comparisons to the siWIPI4 (a) or controls (b,e,h) and two-tailed paired Student’s t-test for comparisons between other samples. f,g,i, Data are the mean ± s.d. Two-tailed paired Student’s t-test. ai, n, number of biologically independent experiments. *P < 0.05, **P < 0.01 and ***P < 0.001. Source numerical data are provided.

Source data

Acknowledgments
This image is the copyrighted work of the attributed author or publisher, and ZFIN has permission only to display this image to its users. Additional permissions should be obtained from the applicable author or publisher of the image. Full text @ Nat. Cell Biol.