IMAGE

Fig. 4

ID
ZDB-IMAGE-240418-50
Source
Figures for Zhu et al., 2024
Image
Figure Caption

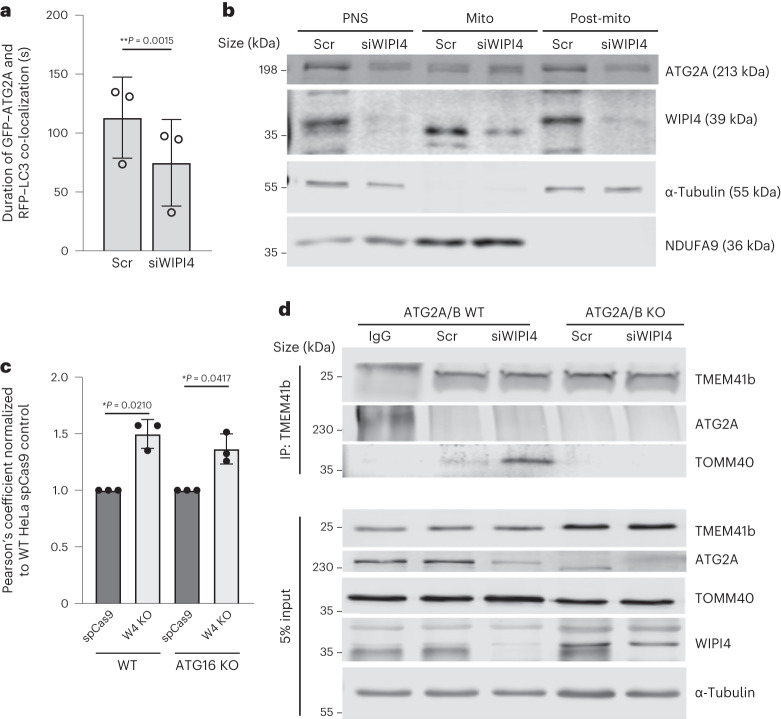
Fig. 4 WIPI4 depletion mislocalizes ATG2.

a, Average duration of GFP–ATG2 and RFP–LC3 co-localization in HeLa cells stably expressing RFP–LC3 quantified from videos taken of living cells (n = 3 independent biological repeats; ≥3 co-localization events in different cells imaged per experiment). The maximum length of each video was 140 s. Data are the mean ± s.d.; two-tailed paired Student’s t-test. b, HeLa cells transfected with control siRNA or siWIPI4 were subjected to cell fractionation and immunoblotted with antibodies to the indicated proteins. For fractionation, isotonic buffer was used. Mitochondria were collected as pellets resuspended in PBS. This may explain the different mobility of WIPI4 in these different fractions. PNS, post-nuclear supernatant; mito, mitochondrial fraction; post-mito, post mitochondrial fraction. c, Pearson’s coefficient of endogenous ATG2A with calnexin in ATG16-KO and wild-type control cells (n = 3 biologically independent experiments; ≥20 fields imaged in each experiment). Data are the normalized mean ± s.d.; two-tailed one-sample Student’s t-test for comparisons to the control and two-tailed paired Student’s t-test for comparisons between other samples. d, ATG2A/B-WT and -KO HeLa cells transfected with control siRNA or siWIPI4 were immunoprecipitated (IP) with endogenous anti-TMEM41b and blotted for ATG2A and TOMM40. *P < 0.05 and **P < 0.01. Source numerical data and unprocessed blots are provided.

Acknowledgments
This image is the copyrighted work of the attributed author or publisher, and ZFIN has permission only to display this image to its users. Additional permissions should be obtained from the applicable author or publisher of the image. Full text @ Nat. Cell Biol.