
|
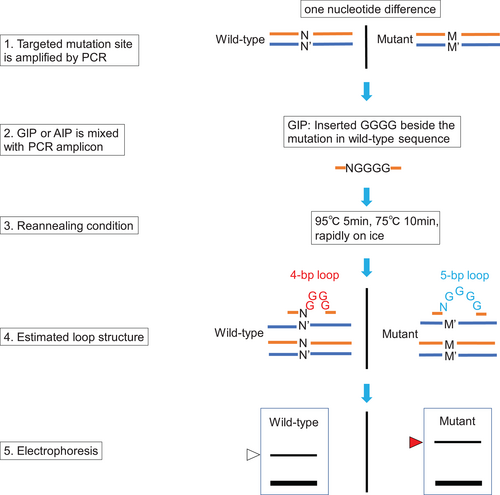
Fig. 1 Schematic overview of the GIP-interacting mobility assay (GIMA). Genomic DNAs of the wild type and the mutant contain a single nucleotide difference (orange sense strand N, blue antisense strand N′ in the wild type; orange sense strand M, blue antisense strand M′ in the mutant). To detect the single nucleotide difference, the targeted genomic locus is amplified by PCR as described in the Materials and Methods section. The PCR amplicon is mixed with GIP or AIP and subsequently incubated under reannealing conditions in a thermal cycler. Because the GIP–wild-type complex and the GIP–mutant complex form a 4-bp loop (red) and a 5-bp loop (light blue), respectively, they are separable by electrophoresis using a polyacrylamide gel. The white arrowhead indicates the GIP–wild-type complex. The red arrowhead indicates the GIP–mutant complex.