
IMAGE
Fig. 4
- ID
- ZDB-IMAGE-240417-25
- Publication
- Sharma et al., 2023 - Novel Development of Magnetic Resonance Imaging to Quantify the Structural Anatomic Growth of Diverse Organs in Adult and Mutant Zebrafish
- All Figures
- Figures for Sharma et al., 2023
Image
|
Figure Caption
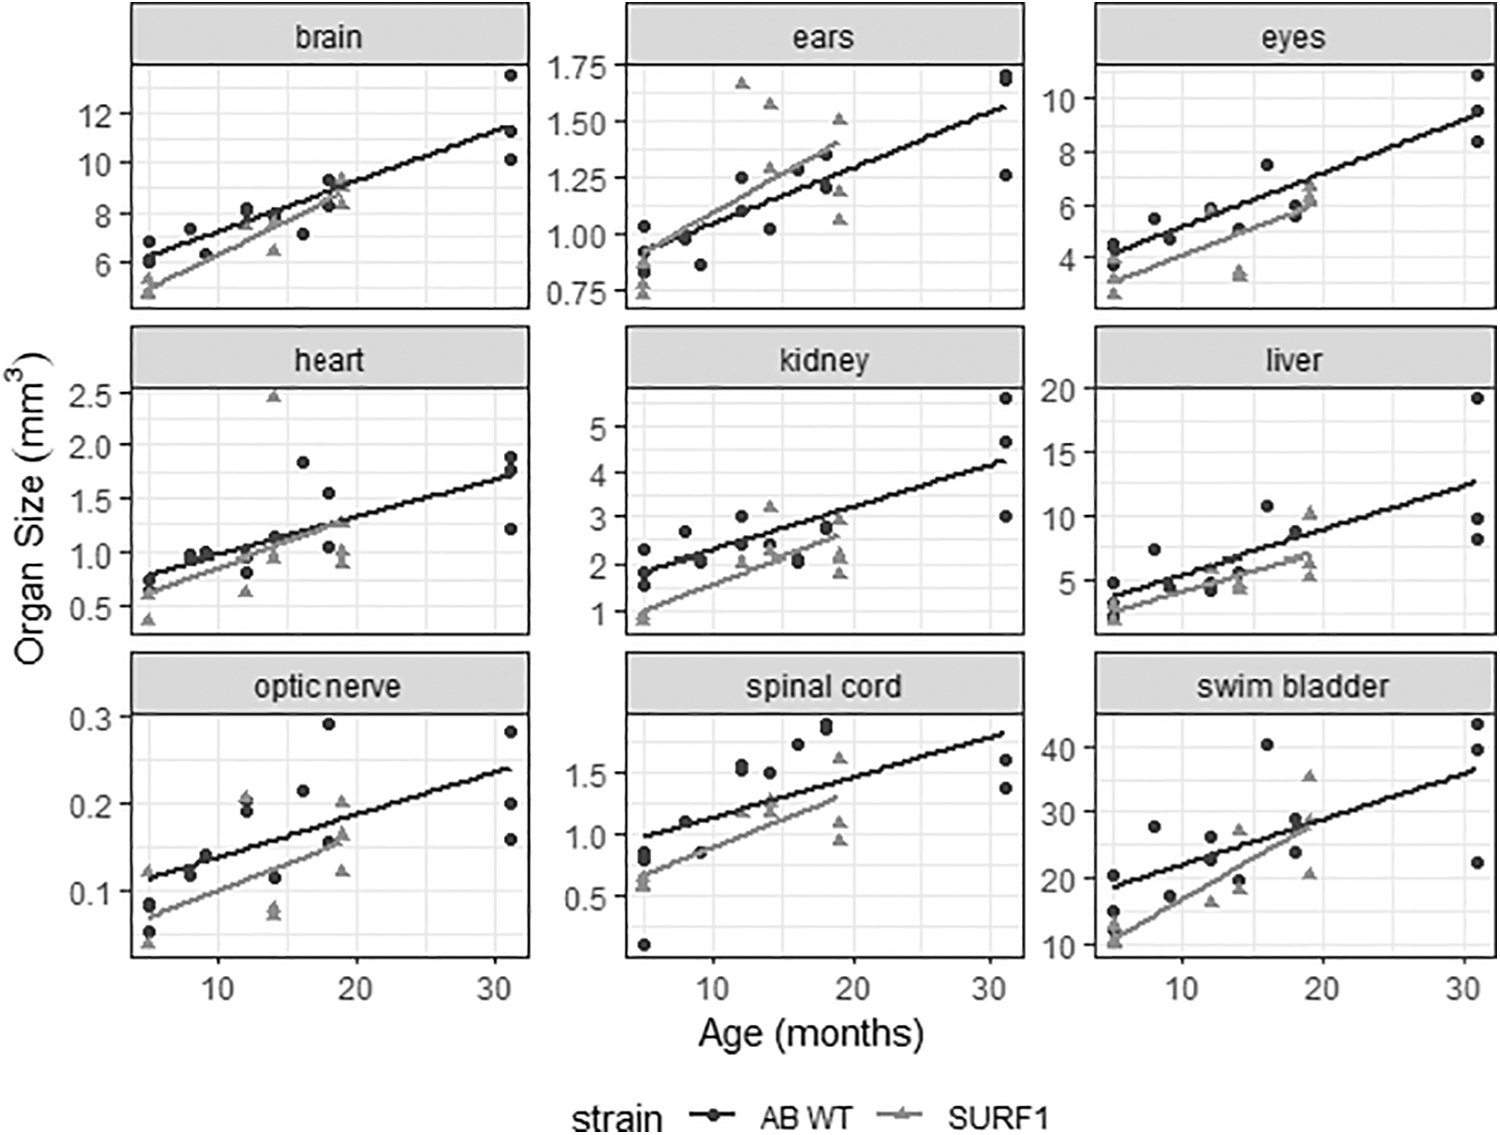
Fig. 4 Comparative volumetric analysis in surf1−/− mutants from 5 to 19 months post-fertilization relative to age-matched WT controls. Each dot indicates a single animal. Black line and dots are WT, gray line and triangles are surf1−/−.
Figure Data
Acknowledgments
This image is the copyrighted work of the attributed author or publisher, and
ZFIN has permission only to display this image to its users.
Additional permissions should be obtained from the applicable author or publisher of the image.
Full text @ Zebrafish