IMAGE

Fig 6

ID
ZDB-IMAGE-240416-40
Source
Figures for Jiang et al., 2024
Image
Figure Caption

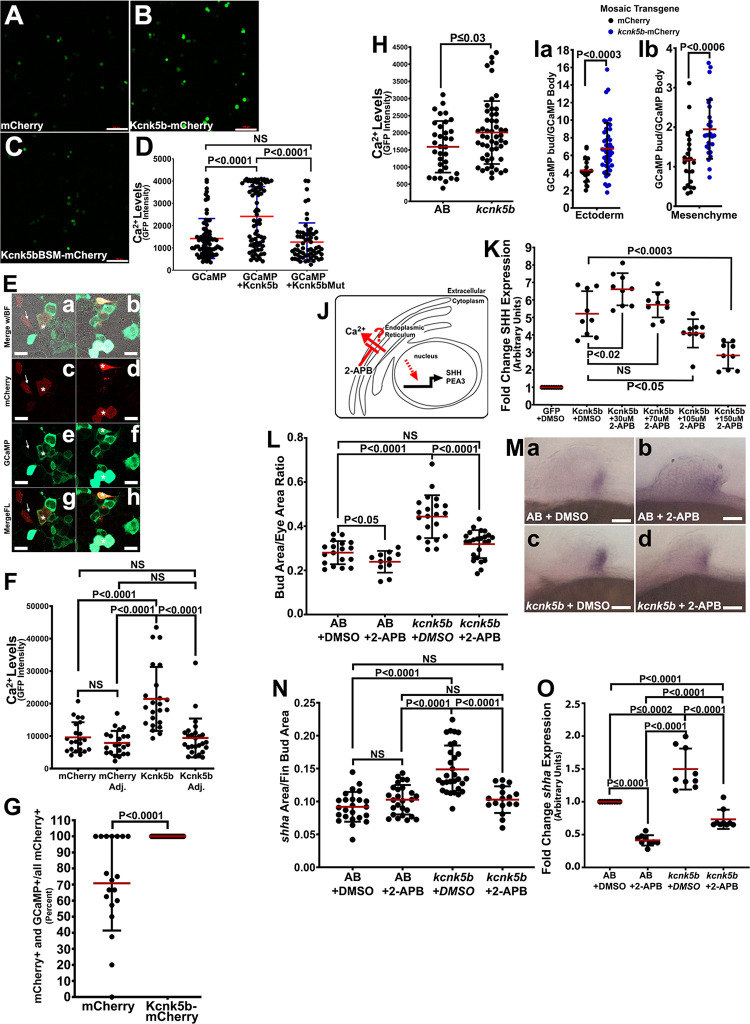
Fig 6 Kcnk5b activity induces IP3R-mediated Ca2+ release from the ER.

(A) GCaMP6s fluorescence in HEK293 cells. (B) GCaMP6s fluorescence in HEK293 cells expressing Kcnk5-mCherry. (C) GCaMP6s fluorescence in HEK293 cells expressing Kcnk5BSM-mCherry. (D) Fluorescence measurements of indicated groups. (E) Representative confocal images of mCherry-transfected, GCaMP6s-transfected cells showing brightfield with merged fluorescence from mCherry and GCaMP6s (a) or mCherry (c) or GCaMP6s (e) or merged mCherry-GCaMP6s (g), and Kcnk5b-mCherry-transfected, GCaMP6s-transfected cells: brightfield with merged fluorescence from mCherry and GCaMP6s (b) or Kcnk5b-mCherry (d) or GCaMP6s (f) or merged mCherry-GCaMP6s (h). (F) Measurements of GCaMP6s fluorescence intensity from the indicated experimental transfection groups. (G) Percents of mCherry-GCaMP6s-double positive over the total number of mCherry-positive cells in each group relate the frequency of GCaMP6s-positive cells in the mCherry or Kcnk5b-mCherry groups. (H) GCaMP6s fluorescence in the pectoral fin buds of transgenic fish harboring both Tg[Cca.actb:GCaMP6s] and Tg[hsp70:kcnk5b-mCherry]. (I) GCaMP6s fluorescence in embryos harboring the stable transgenic fish line Tg[Cca.actb:GCaMP6s] that mosaically express patches of mCherry or kcnk5b-mCherry (designated mCherry+) for the ectoderm (a) and mesenchyme (b). (J) Diagram of IP3R inhibition by 2-APB. (K) qRT-PCR of SHH expression in HEK293 cells transfected either with GFP or Kcnk5b-GFP after 20-h treatment with 2-APB at the indicated concentrations. (L) Assessment of pectoral fin bud size at 48 hpf after 4 h of treatment with 13 μm 2-APB. (M) Expression of shha in pectoral fin buds of heat-shocked non-transgenic sibling embryos after 4-h treatment with DMSO (a) or 13 μm 2-APB (b), of heat-shocked transgenic Tg[hsp70:kcnk5b-mCherry] siblings after 4-h treatment with DMSO (c) or 13 μm 2-APB (d). (N) Pixel area of in situ staining of shha in the indicated treatment groups. (O) qRT-PCR of shha expression in isolated fin buds of the indicated groups. Experiments were repeated 3 or more time (N ≥ 3). For cell culture experiments, each repeat contained duplicate or triplicate wells, and 10 or more cells were measured per well. Each data point represents 1 cell (D, F, G). For fin bud fluorescence measurements, we measured 2 or 3 locations in each tissue of 1 fin bud per embryo (H, I). For fin bud area measurements, we measured the area of 1 fin bud and eye per embryo. We measured at least 4 embryos per repeat (L). For the qRT-PCR experiments, we collected 80 fin bud samples per isolation. Three or more isolations were measured. Each isolation was measured in duplicate or triplicate. Each measured value is represented as a data point. P values represent statistical analysis by Student’s two-tailed t test. P values >0.05 are designated as “not significant” (NS). Scale bars equal 100 μm (A–C), 10 μm (E), 0.5 μm (M). Numerical data used in this figure are included in S6 Data. ER, endoplasmic reticulum; hpf, hours post fertilization.

Acknowledgments
This image is the copyrighted work of the attributed author or publisher, and ZFIN has permission only to display this image to its users. Additional permissions should be obtained from the applicable author or publisher of the image. Full text @ PLoS Biol.