IMAGE

Fig. 3.

ID
ZDB-IMAGE-240412-45
Source
Figures for Carey et al., 2024
Image
Figure Caption

Fig. 3.

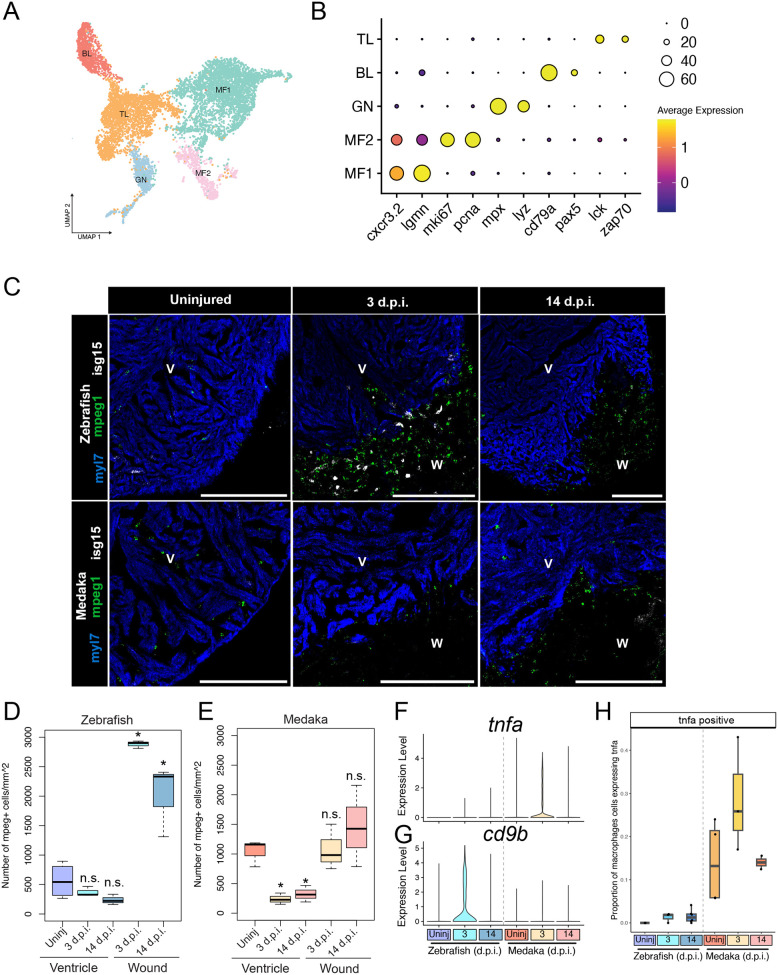
Medaka display altered tissue-resident and injury-responsive immune cell populations. (A) UMAP embedding and sub-clustering of all leukocytes, with cells classified as T lymphocytes (TL), B lymphocytes (BL), granulocytes (GN), or macrophages (MF). (B) Gene expression dot plot of marker genes for each immune cell cluster. (C) RNA in situ hybridization of mpeg1.1 (macrophages), isg15 (interferon response), and myl7 (cardiomyocytes) in ventricle cryosections in the indicated species and time point. Scale bars: 200 µm, anatomical labels: V, intact ventricle; W, wound area. Representative images are shown from at least three animals at each time point. (D,E) Quantification of number of macrophages per mm2 in either the intact myocardium (ventricle) or wound area (wound) in zebrafish (D) or medaka (E) * indicates a P-value <0.05 using a t-test comparing with uninjured ventricle. n=3 individuals were used for macrophage quantification from each timepoint based on an average of three sections per individual. (F,G) Gene expression violin plots from all macrophages in the indicated time point and species for tnfa (F) and cd9b (G). (H) Quantification of the proportion of macrophages expressing tnfa at each time point in each species.

Acknowledgments
This image is the copyrighted work of the attributed author or publisher, and ZFIN has permission only to display this image to its users. Additional permissions should be obtained from the applicable author or publisher of the image. Full text @ Biol. Open