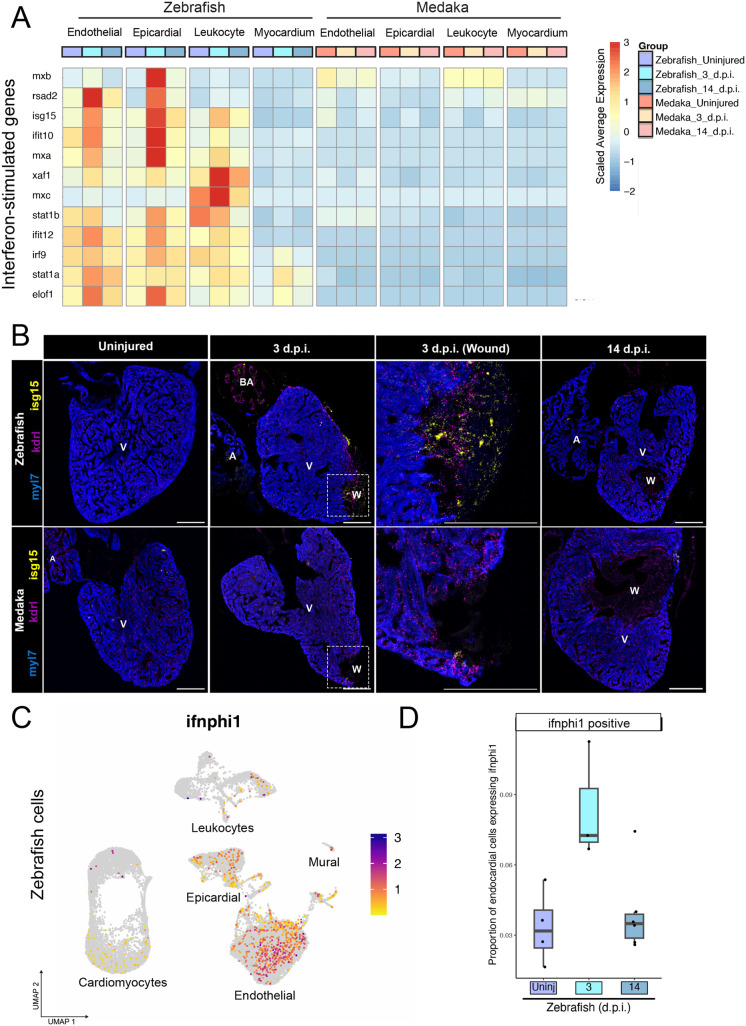
Medaka lack an endogenous injury-induced interferon response. (A) Gene expression heatmap showing scaled average gene expression for 12 interferon-stimulated genes in the indicated species and tissue type at each time point. (B) RNA in situ hybridization of isg15 (interferon-responding cells), kdrl (endothelial cells), and myl7 (cardiomyocytes) in ventricle cryosections in the indicated species and time point. Scale bars: 200 µm. Anatomical labels: V, intact ventricle; BA, bulbus arteriosus; W, wound area. Images are representative of at least three individuals at each time point. (C) Gene expression feature plot for ifnphi1 across all zebrafish cardiac cell types, color scale=expression level. (D) Quantification of proportion of zebrafish endothelial cells expressing ifnphi1 at each time point.
Acknowledgments
This image is the copyrighted work of the attributed author or publisher, and
ZFIN has permission only to display this image to its users.
Additional permissions should be obtained from the applicable author or publisher of the image.
Full text @ Biol. Open
Your Input Welcome
Thank you for submitting comments. Your input has been emailed to ZFIN curators who may contact you if
additional information is required.
Oops. Something went wrong. Please try again later.