
IMAGE

Fig. 7

ID
ZDB-IMAGE-240412-21
Source
Figures for Fishman et al., 2024
Image
Figure Caption

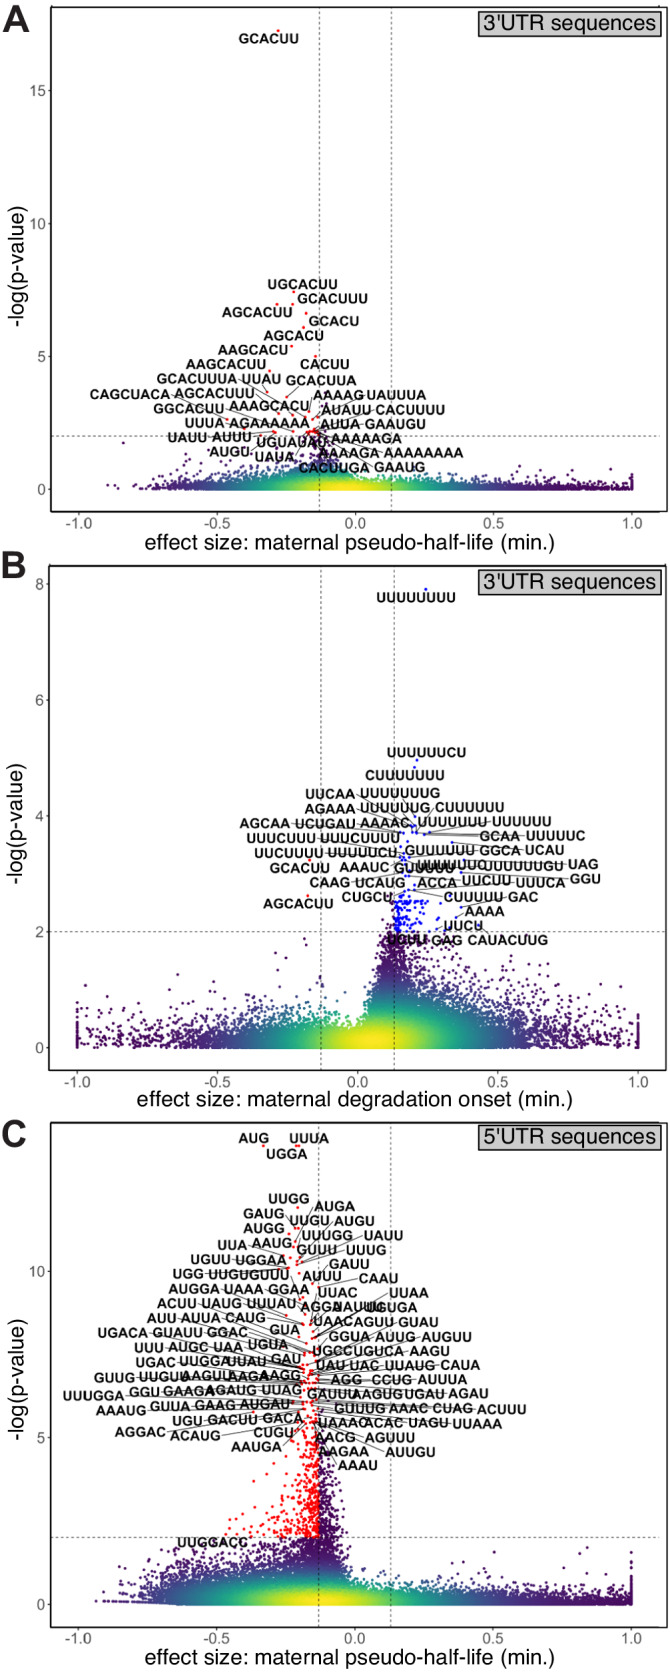
Fig. 7 Sequence enrichments associated with regulatory rates of mRNA degradation.

Volcano plots for the enrichments of short sequences of length 3–8 bases (k-mers) based on difference between estimated parameters for genes that include this short sequence in their sequence and those that do not. Plots show the significance (y-axis, −log10(p value), one-sided Kolmogorov-Smirnov FDR < 1%) and the effect size (x-axis, difference in the standard mean of each of the two distributions). Horizontal dashed line is 1% FDR, vertical dashed line is an absolute effect size of 0.13. A Enrichments in longest annotated 3′UTR for the maternal pseudo-half-life parameter (log2). B Enrichments in longest annotated 3′UTR for the maternal degradation onset time parameter. C Enrichments in longest annotated 5′UTR for the maternal pseudo-half-life parameter (log2). Colors represent density (yellow = high density; blue = low density). Dashed lines represent thresholds for significance. Top short sequences are noted on plots.

Acknowledgments
This image is the copyrighted work of the attributed author or publisher, and ZFIN has permission only to display this image to its users. Additional permissions should be obtained from the applicable author or publisher of the image. Full text @ Nat. Commun.