IMAGE

Fig 4

ID
ZDB-IMAGE-240331-42
Source
Figures for Guerrero-Limón et al., 2024
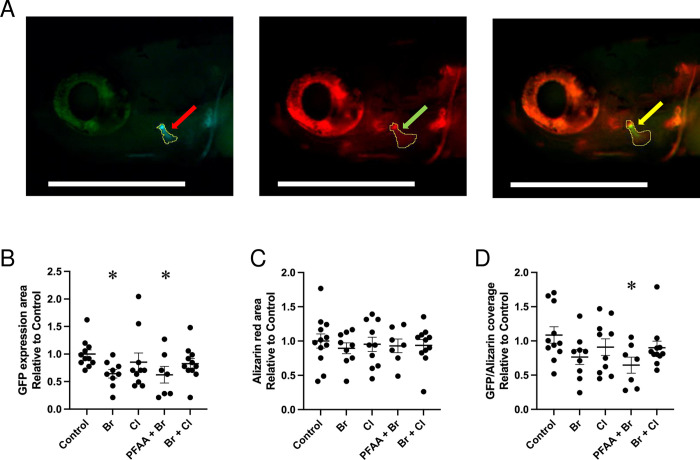
Image
Figure Caption

Fig 4 GFP staining in Tg(col10a1a:col10a1a-GFP) and alizarin red staining of the opercle in 10 dpf zebrafish.

(A) Example of an individual control larva illustrating the green fluorescence of the col10a1a-GFP fusion protein (left), the red fluorescence of the live alizarin red staining (middle) and an overlay of both (right). The outline of the fluorescent areas is shown (red, green, and yellow arrows). Lateral view, anterior to the left, the scale bar represents 500 μm; (B) Plot of the opercle area revealed by the green fluorescent col10a1a-GFP fusion protein; (C) Plot of the opercle area stained with alizarin red D) Plot of the ratio between the green fluorescent and red fluorescent opercle area measured in control larvae and larvae upon treatment with the indicated mixture (n ≥ 7). Ordinary one-way ANOVA and Dunnett’s multiple comparison test were performed. Significant difference relative to control is indicated: p value < 0.05 (*).

Acknowledgments
This image is the copyrighted work of the attributed author or publisher, and ZFIN has permission only to display this image to its users. Additional permissions should be obtained from the applicable author or publisher of the image. Full text @ PLoS One