
Image
|
Figure Caption
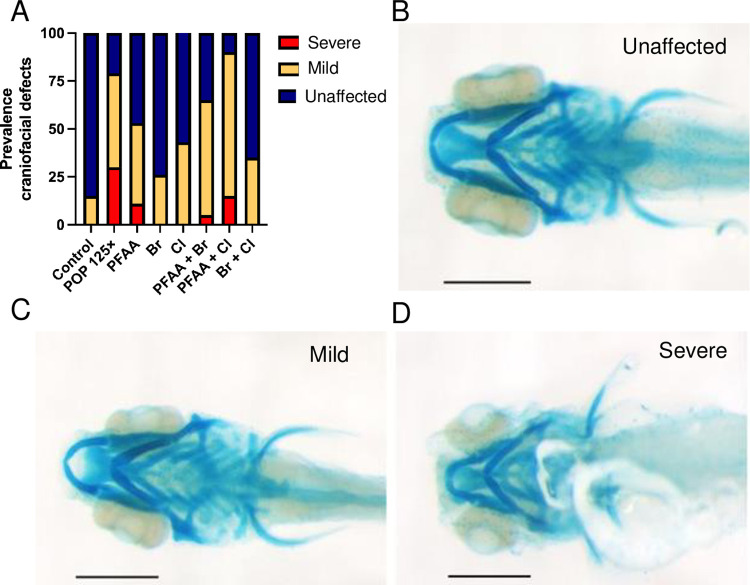
Fig 2 Prevalence of craniofacial defects and examples of such defects.
(A) Percentage of fish presenting craniofacial defects, (B-D) Examples of phenotypes used to catalogue fish in each category: (B) normal, (C) mild, (D) severe phenotype. The scale bar represents 200 μm.
Acknowledgments
This image is the copyrighted work of the attributed author or publisher, and
ZFIN has permission only to display this image to its users.
Additional permissions should be obtained from the applicable author or publisher of the image.
Full text @ PLoS One