
Image
|
Figure Caption
Figure 2
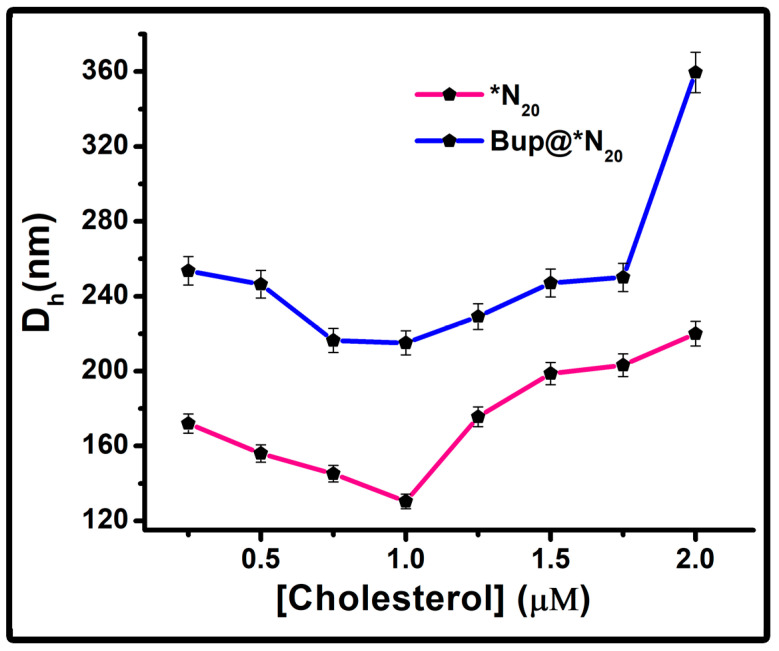
Representation of colloid particle size distribution with scattered plot of N20 and Bup@N20 with varying cholesterol concentration.
Acknowledgments
This image is the copyrighted work of the attributed author or publisher, and
ZFIN has permission only to display this image to its users.
Additional permissions should be obtained from the applicable author or publisher of the image.
Full text @ Pharmaceuticals (Basel)