
Fig. 3
- ID
- ZDB-IMAGE-240328-91
- Publication
- Lazzaroni et al., 2023 - Circulating biomarkers in familial cerebral cavernous malformation
- All Figures
- Figures for Lazzaroni et al., 2023
|
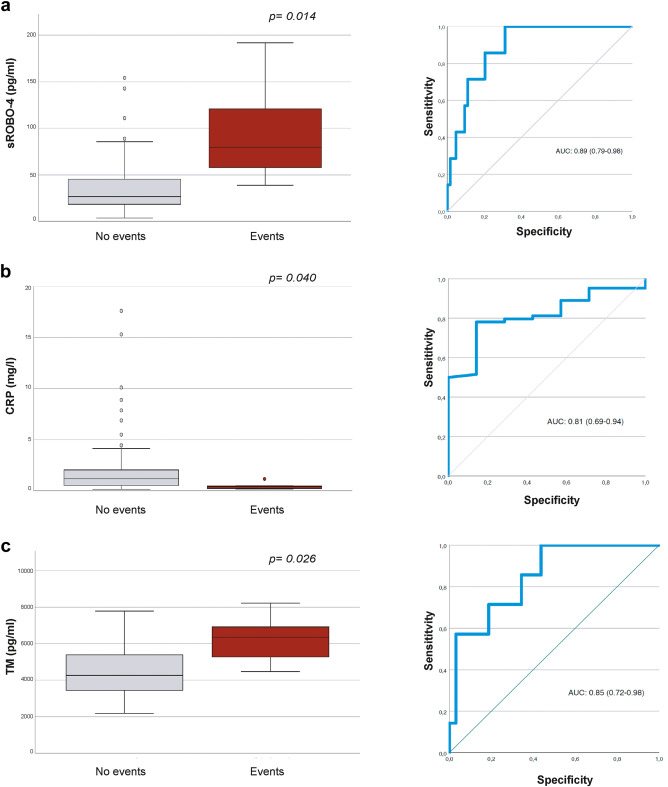
Fig. 3 Plasma concentrations of sROBO4, TM and CRP by incident adverse clinical events and ROC curve analyses. Box and whisker plots (box represent the interquartile range and outliers are 1.5 box lengths from median) of the plasma concentrations of (a) sROBO4, (b) CRP and (c) TM in patients who had confirmed incident adverse CCM-related clinical events that occurred during the 2-years trial period (n = 3 technical replicates). The AUC ROC curve analyses of the differentiation between the participants who experienced clinical events versus patients without any clinical outcomes. The p-values were calculated by means of Kruskall Wallis test and account for false discovery rate (FDR).