
Fig. 1
- ID
- ZDB-IMAGE-240328-27
- Publication
- Seebacher et al., 2023 - Warming and pollution interact to alter energy transfer efficiency, performance and fitness across generations in zebrafish (Danio rerio)
- All Figures
- Figures for Seebacher et al., 2023
|
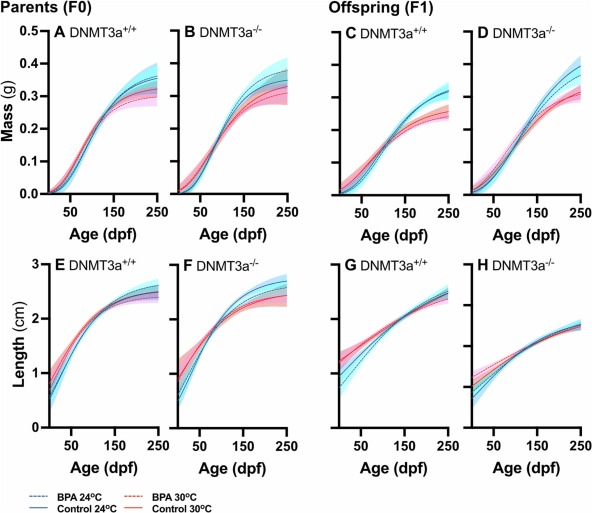
Fig. 1 Growth of parents (F0) and offspring (F1). Change in parents mass (A, B) and length (E, F), and offspring mass (C, D) and length (G, H) during development was determined by interactions between genotypes (A, C, D, E no-template control [DNMT3+/+]; B, D, F, G CRISPR knock-out [DNMT3a−/−]), (parental) BPA exposure (BPA = broken lines, control = solid lines), temperature (24 °C = blue lines; 30 °C = red lines), and age (days post-fertilisation [dpf]). The lines represent Gompertz models fitted to data from individual fish, and shading around lines (turquoise and pink = BPA; blue and orange = control) shows 95 % confidence intervals. Sample sizes were n = 10–12 fish per treatment, and raw data are shown in Supplementary material Fig. S1 and S2.