IMAGE

FIGURE 9

ID
ZDB-IMAGE-240327-13
Source
Figures for Angom et al., 2024
Image
Figure Caption

FIGURE 9

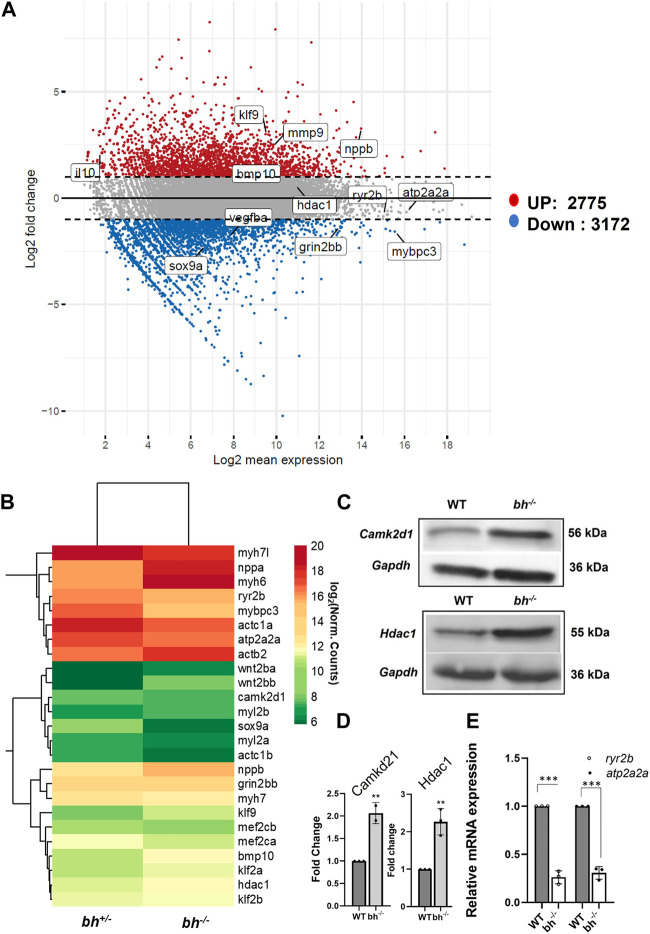
Transcriptome analysis of bigheart mutant. (A) MA-plot for differential expression analysis in RNA-seq of bh+/− and bh−/−, x axis indicates the normalized mean expression (Log2 mean expression) and the y axis indicates the log 2 fold change (Red dots: upregulated genes and the blue dots: downregulated genes) (Log2 normal count). (B) Heat map showing differential expression of selected cardiac genes in bh+/− and bh−/− heart tissue (Log2 normal count). (C) Western blot analysis of calcium handling gene, Camk2d1 and cardiac remodeling gene, Hdac1 in adult heart tissue. (D) Quantification of Western blot in (C). (E) mRNA expression of calcium handling genes ryr2b and atp2a2a in bh+/− and bh−/− heart. RT PCR analyses were performed three times in triplicates. **p < 0.01 and ***p < 0.001. The bars indicate the average values ± SD.

Acknowledgments
This image is the copyrighted work of the attributed author or publisher, and ZFIN has permission only to display this image to its users. Additional permissions should be obtained from the applicable author or publisher of the image. Full text @ Front Cell Dev Biol