
|
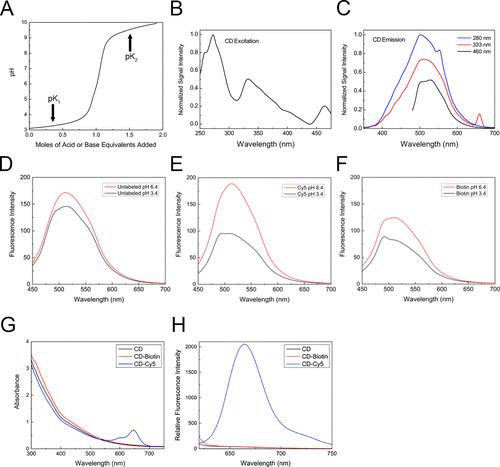
Fig. 2 pH and cargo influence CD fluorescence. (A) Titration curve of a 0.05 mg/mL CD suspension using HCl and NaOH. The two pKas found were pK1 = 3.4 and pK2 = 9.6. (B) CD excitation signal intensity was determined across different wavelengths. (C) CD emission spectra were recorded at 280, 333, and 460 nm excitation wavelengths at pH 6.4. (D-F) CD (D), CD-Cy5 (E), and CD-biotin (F) fluorescence spectra were obtained under 420 nm excitation light at pH values of 3.4 (black line) and 6.4 (red line). Absorbance (G) and emission (H) spectra of CD, CD-biotin, and CD-Cy5 show Cy5 absorption and emission peaks in the 600–700 nm range.