
|
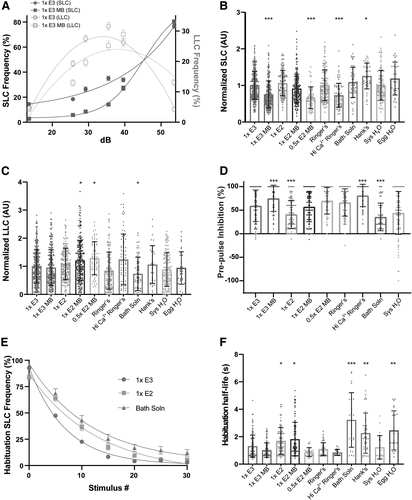
Fig. 3 Embryo medium type impacts auditory-driven behaviors. (A) Acoustic startle responses, average SLC frequency (left y-axis), and LLC frequency (right y-axis) as acoustic stimulus intensity increases in 1 × E3 or 1 × E3 with methylene blue-treated larvae (mean ± SEM). (B) Normalized SLCs and (C) LLCs (AU), calculated by the area under the SLC or LLC frequency curves, respectively, for individual larvae, normalized to 1 × E3 (1 × E3: n = 397; 1 × E3 MB: n = 245; 1 × E2: n = 166; 1 × E2 MB: n = 231; 0.5 × E2 MB: n = 64; Ringer's: n = 141; Hi Ca2+ Ringer's: n = 79; Bath Solution: n = 61; Hank's: n = 36; Sys H2O: n = 123; Egg H2O: n = 36) (mean ± SD). (D) Rate of prepulse inhibition (1 × E3: n = 263; 1 × E3 MB: n = 118; 1 × E2: n = 108; 1 × E2 MB: n = 137; 0.5 × E2 MB: n = 63; Ringer's: n = 115; Hi Ca2+ Ringer's: n = 62; Bath Solution: n = 61; Sys H2O: n = 123) (mean ± SD). (E) Short-term habituation, average SLC frequency during 30 acoustic stimuli at highest intensity in 1 × E3-, 1 × E2-, and Bath Solution-treated larvae (mean ± SEM). (F) SLC half-life calculated by nonlinear regression (one-phase exponential decay) of SLC frequency curves for individual larvae. Asterisks represent statistical significance for medium type compared to 1 × E3 (mean ± SD, Wilcoxon/Kruskal–Wallis tests with Wilcoxon Each Pair for nonparametric multiple comparisons, *p < 0.01, **p < 0.001, ***p < 0.0001). AU, arbitrary unit.