
|
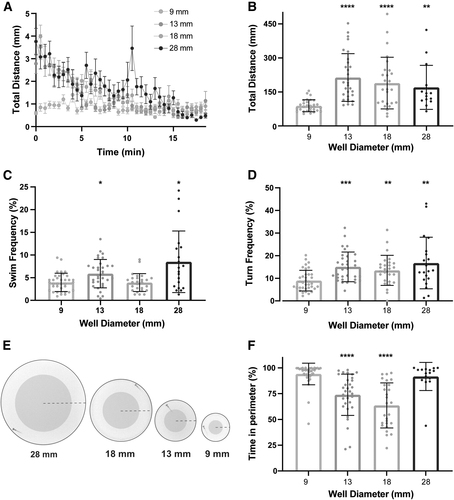
Fig. 2 Arena size influences general locomotor activity and thigmotaxis behavior. (A) Total distance time plot during 18.5 min of recording comparing testing arena sizes (9 mm: n = 30; 13 mm: n = 30; 18 mm: n = 26; 28 mm: n = 20) (mean ± SEM). (B) Sum of distance traveled for individual larvae, and (C) swim and (D) turn frequencies (mean ± SD). (E) Images of each testing arena, with the shaded area indicating the center and the non-shaded area indicating the perimeter of the arena. The dashed line indicates the arena radius. (F) Percent of time spent in the perimeter during the 18.5 min testing period. Asterisks represent statistical significance for arena sizes compared to 9 mm arena (mean ± SD, Wilcoxon/Kruskal–Wallis tests with Wilcoxon Each Pair for nonparametric multiple comparisons, *p < 0.05, **p < 0.01, ***p < 0.001, ****p < 0.0001).