
Fig 1
- ID
- ZDB-IMAGE-240321-16
- Publication
- Ortiz et al., 2024 - A single base pair substitution in zebrafish distinguishes between innate and acute startle behavior regulation
- All Figures
- Figures for Ortiz et al., 2024
|
Fig 1
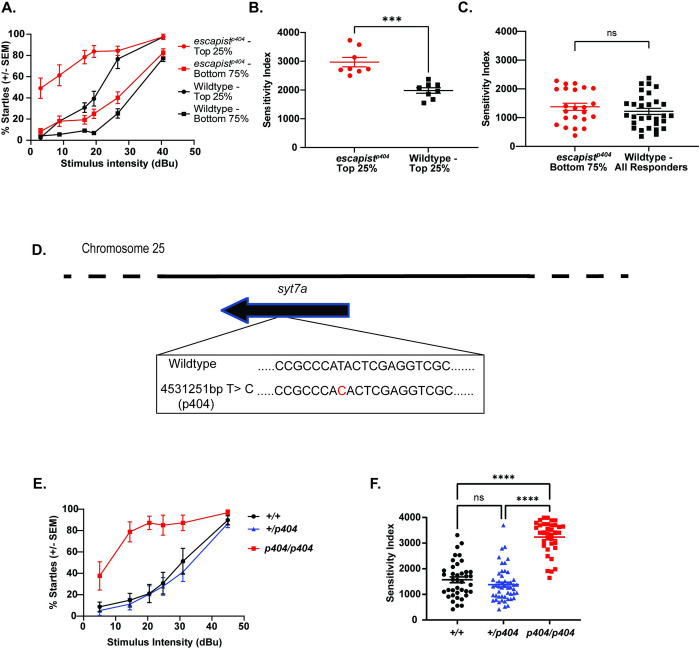
RNA sequencing linkage analysis identifies a single base pair change on Chromosome 25 that is tightly linked to the
(A) Acoustic sensitivity curve for