
Fig. 8
- ID
- ZDB-IMAGE-240319-31
- Publication
- Megerson et al., 2023 - Kremen1 regulates the regenerative capacity of support cells and mechanosensory hair cells in the zebrafish lateral line
- All Figures
- Figures for Megerson et al., 2023
|
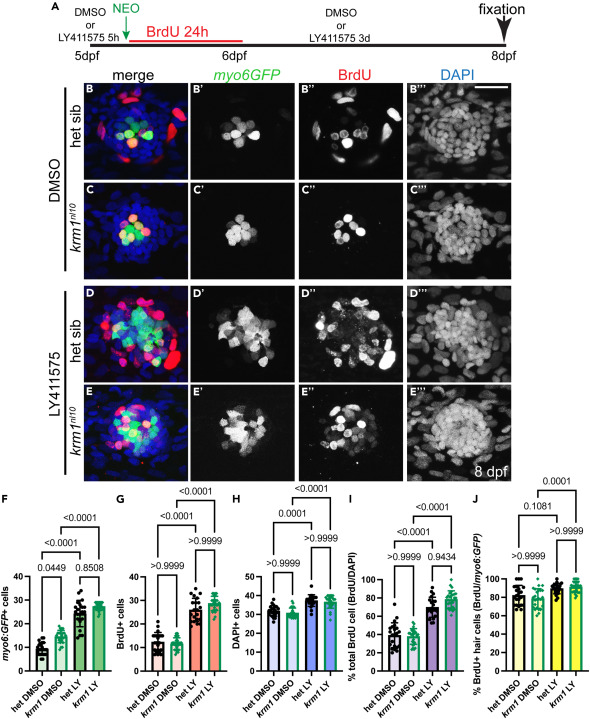
Fig. 8 Notch signaling regulates cellular proliferation during regeneration in krm1nl10 neuromasts (A) Timeline of drug exposure between 5-8dpf. DMSO or LY411575 at 5dpf for 5-h prior to NEO exposure, NEO exposure, BrdU incubation for 24 h h in the presence of DMSO or LY411575, and then regeneration to 8dpf with exposure to DMSO or LY411575. (B–E‴) Confocal projections of L2 neuromasts at 8dpf expressing Tg(myosin6b:GFP)w186 to label regenerated hair cells (myo6:GFP green), BrdU incorporation (red), and DAPI labeling of nuclei (blue) in heterozygous sibling and krm1nl10 mutant larvae following exposure to DMSO or LY411575. (F–J) Quantification of myo6:GFP-labeled hair cells at 8dpf following regeneration during exposure to DMSO or LY411575, BrdU-labeled NM cells 8dpf following regeneration during exposure to DMSO or LY411575, percentage of BrdU-positive cells/DAPI-labeled nuclei in NMs, and percentage of myo6:GFP-labeled hair cell co-labeled with BrdU. DMSO-exposed heterozygous siblings n = 22 NM (9 fish) and krm1nl10 n = 26 NM (9 fish); LY411575-exposed heterozygous siblings n = 20 NM (11 fish) and krm1nl10 n = 26 NM (9 fish). All data presented as mean ± SD, Kruskal-Wallis test, Dunn’s multiple comparisons test. Scale bar = 20 μm. See also Figure S3.