
Fig. 3
- ID
- ZDB-IMAGE-240319-26
- Publication
- Megerson et al., 2023 - Kremen1 regulates the regenerative capacity of support cells and mechanosensory hair cells in the zebrafish lateral line
- All Figures
- Figures for Megerson et al., 2023
|
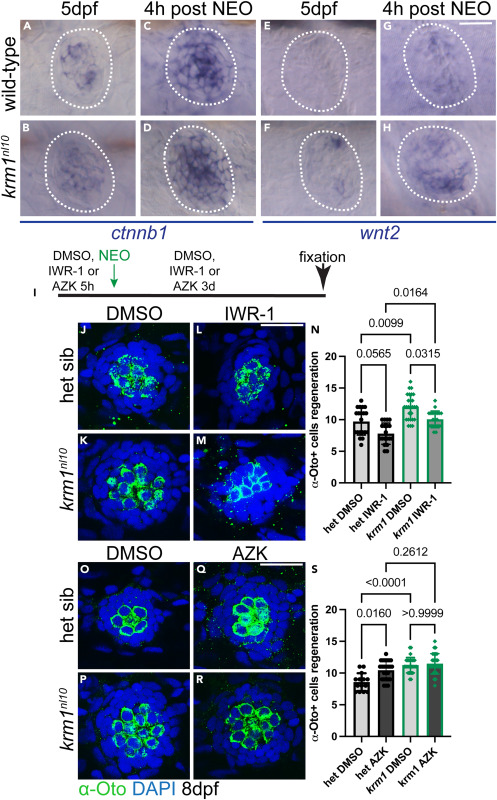
Fig. 3 Wnt signaling is active during regeneration in krm1nl10 neuromasts (A–D) Representative images of RNA in situ hybridization at 5dpf of ctnnb1 expression in wild-type and krm1nl10 mutant NMs without exposure to NEO and 4 h post NEO exposure. (E–H) wnt2 expression in wild-type and krm1nl10 mutant NMs without exposure to NEO and 4 h post NEO exposure. Scale bar = 20 μm. (I) Timeline of DMSO or inhibitor exposure, NEO-induced hair cell ablation, and regeneration between 5dpf and 8dpf. (J–M) Confocal projects of 8dpf NMs following regeneration, hair cells are labeled with α-Otoferlin antibody (green) and nuclei are labeled with DAPI (blue) in heterozygous sibling or krm1nl10 NMs with exposure to DMSO or IWR-1. (N) Quantification of α-Otoferlin-positive cells. DMSO-exposed heterozygous sibling n = 20 NM (8 fish) and IWR-1-exposed heterozygous sibling n = 19 NM (9 fish), and DMSO-exposed) and IWR-1-exposed krm1nl10 n = 20 NM (9 fish). (O–R) Confocal projects of 8dpf NMs following regeneration, hair cells are labeled with α-Otoferlin antibody (green) and nuclei are labeled with DAPI (blue) in heterozygous sibling or krm1nl10 NMs with exposure to DMSO or AZK. (S) Quantification of α-Otoferlin-positive cells. DMSO-exposed heterozygous sibling n = 14 NM (8 fish) and DMSO-exposed krm1nl10 n = 29 NM (9 fish), and AZK-exposed heterozygous sibling n = 26 NM (11 fish) and AZK-exposed krm1nl10 n = 28 NM (9 fish). All data presented as mean ± SD, Kruskal-Wallis test, Dunn’s multiple comparisons test. Scale bar = 20 μm. See also Figure S1.