IMAGE

Figure S3.

ID
ZDB-IMAGE-240315-98
Source
Figures for Pozo-Morales et al., 2024
Image
Figure Caption

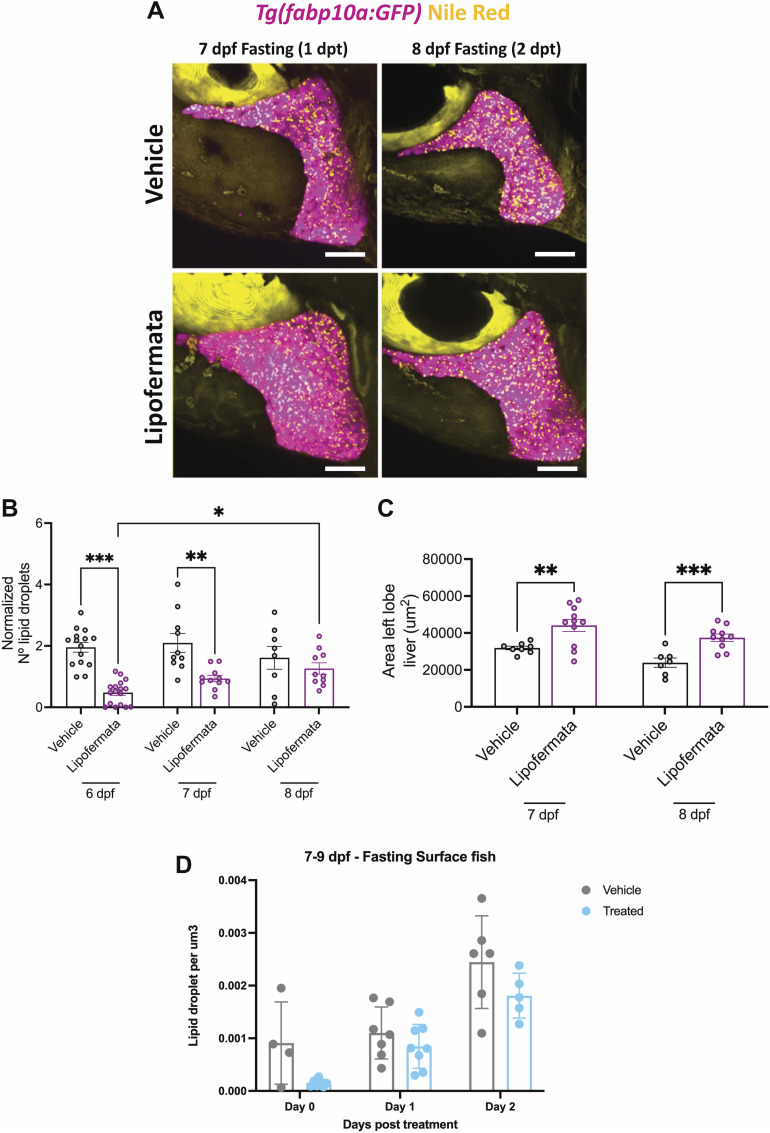
Figure S3. Accumulation of hepatic lipid droplets after removal of lipofermata.

(A, B, C)Tg(fabp10a:GFP) zebrafish were treated with 5 μM of lipofermata or 0.01% of DMSO (vehicle) from 4 to 6 dpf fast. The drugs were washed, and the animals were allowed to recover. (A) Maximum-intensity projections of 7 and 8 dpf fasting Tg(fabp10a:GFP) (pink) with Nile Red staining (yellow) treated with 5 μM of lipofermata or 0.01% of DMSO (vehicle) from 4 to 6 dpf fast. Scale bar = 20 μm. (B, C) Barplot with the mean ± SEM of the number of lipid droplets per liver (B) and liver size (C) in vehicle- and lipofermata-treated animals. (D) Surface fish larvae were treated with 2 μM of lipofermata or 0.01% of DMSO (vehicle) from 5 to 7 dpf fast. The drugs were washed, and the animals were allowed to recover for 48 h. Barplot with the mean ± SD of the number of lipid droplets normalized by liver volume in vehicle- and lipofermata-treated surface fish larvae. Each point represents a single animal. *P < 0.05, **P < 0.01, and ***P < 0.001, t test.

Acknowledgments
This image is the copyrighted work of the attributed author or publisher, and ZFIN has permission only to display this image to its users. Additional permissions should be obtained from the applicable author or publisher of the image. Full text @ Life Sci Alliance