IMAGE

Figure 1.

ID
ZDB-IMAGE-240315-92
Source
Figures for Pozo-Morales et al., 2024
Image
Figure Caption

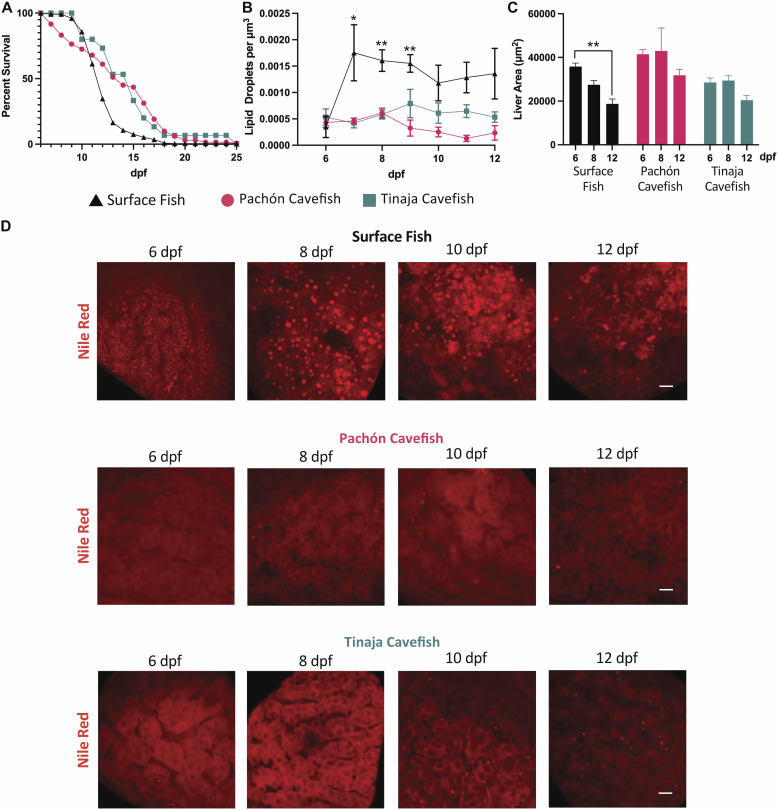
Figure 1. Response of cavefish and surface fish larvae to starvation.

(A) Survival curves for surface fish, Pachón cavefish, and Tinaja cavefish larvae upon starvation are shown by log-rank Kaplan–Meier plots with a 95% confidence interval. (B) Number of hepatic lipid droplets per unit volume from 6 to 12 dpf under fasting. (C) Mean ± SEM of liver size in surface fish, Pachón cavefish, and Tinaja cavefish at 6, 8, and 12 dpf without exogenous feeding. **P < 0.01. (D) Maximum-intensity projections of representative livers from surface fish, Pachón cavefish, and Tinaja cavefish stained with Nile Red (red) at 6, 8, 10, and 12 dpf without exogenous feeding. Scale bar = 10 μm.

Acknowledgments
This image is the copyrighted work of the attributed author or publisher, and ZFIN has permission only to display this image to its users. Additional permissions should be obtained from the applicable author or publisher of the image. Full text @ Life Sci Alliance