IMAGE

Figure 1

ID
ZDB-IMAGE-240315-85
Source
Figures for Gao et al., 2024
Image
Figure Caption

Figure 1

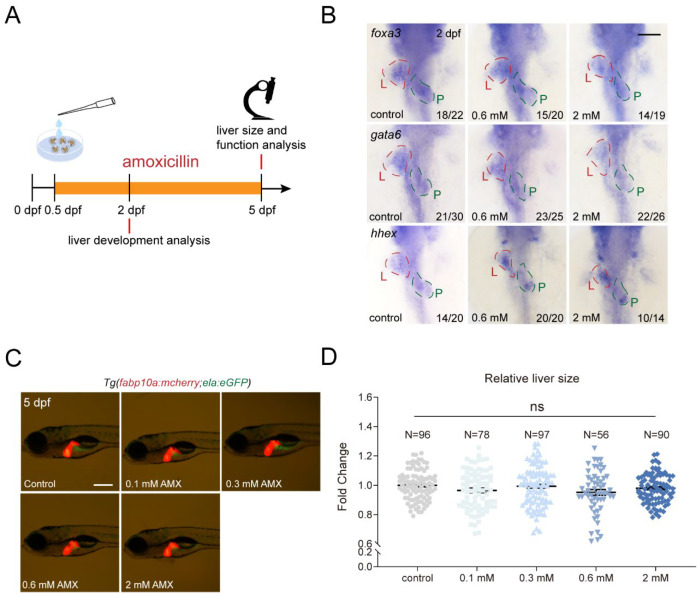
Amoxicillin treatment does not affect zebrafish liver development. (A) Schematic diagram of amoxicillin treatment. (B) Whole-mount in situ hybridization (WISH) revealed the expression of foxa3, gata6 and hhex at 2 dpf after amoxicillin treatment. Ventral view, anterior to the top. L—liver (red dashed lines); P—pancreas (green dashed lines). Numbers indicate the ratio of representative staining observed. (C) Liver (red) size at 5 dpf after amoxicillin treatment as shown in the transgenic reporter line Tg(fabp10a:mCherry; ela:eGFP). Lateral view, anterior to the left. (D) Quantification of relative liver size at 5 dpf. The numbers of larvae used for each condition are indicated. In the ANOVA analysis, ns—not significant. Scale bars, 100 µm. AMX—amoxicillin; dpf—days post-fertilization.

Acknowledgments
This image is the copyrighted work of the attributed author or publisher, and ZFIN has permission only to display this image to its users. Additional permissions should be obtained from the applicable author or publisher of the image. Full text @ Int. J. Mol. Sci.