IMAGE

Fig. 3

ID
ZDB-IMAGE-240315-31
Source
Figures for Walter et al., 2024
Image
Figure Caption

Fig. 3

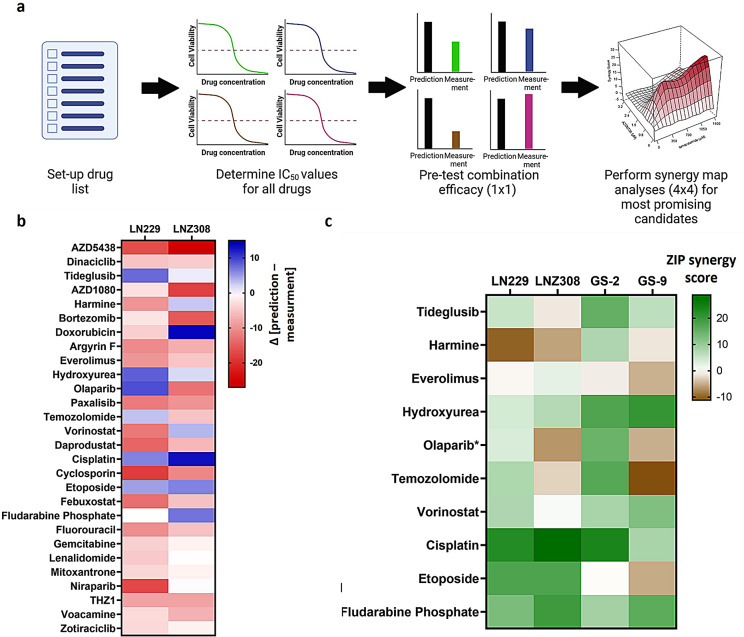
Functionally-instructed combination therapies in vitro. a, Schematic workflow of the functionally-instructed drug screen. For all selected drugs IC50 values were determined. Then, a pre-selection screen, i.e. 1 × 1 (IC50xIC50) combination of AZD6738 plus drug of interest, was set-up. All combinations with AZD6738 resulting in higher efficacy than additive interaction were then included in 4 × 4 synergy map analyses. b, Analysis of the 1 × 1 pre-selection screen (n = 1 with 8 technical replicates per sample). The heatmap depicts the delta value between prediction of additive drug-drug interaction and measured viability (Bliss synergy score). Positive values (blue) indicate a higher efficacy of the drug combination than predicted, negative values (red) indicate a lower efficacy of the drug combination than predicted. Tideglusib, harmine, everolimus, hydroxyurea, olaparib, temozolomide, vorinostat, cisplatin, etoposide and fludarabine phosphate were selected as top candidates. c, Analysis of the 4 × 4 synergy map experiments. Heatmap depicts the average ZIP synergy score across tested combinations (n = 2). Green coloring indicates high synergism scores, brown coloring negative synergism scores. Hydroxyurea, cisplatin and fludarabine phosphate show positive synergism values across all four cell lines tested

Acknowledgments
This image is the copyrighted work of the attributed author or publisher, and ZFIN has permission only to display this image to its users. Additional permissions should be obtained from the applicable author or publisher of the image. Full text @ J. Exp. Clin. Cancer Res.