IMAGE

Fig. 1

ID
ZDB-IMAGE-240315-27
Source
Figures for Walter et al., 2024
Image
Figure Caption

Fig. 1

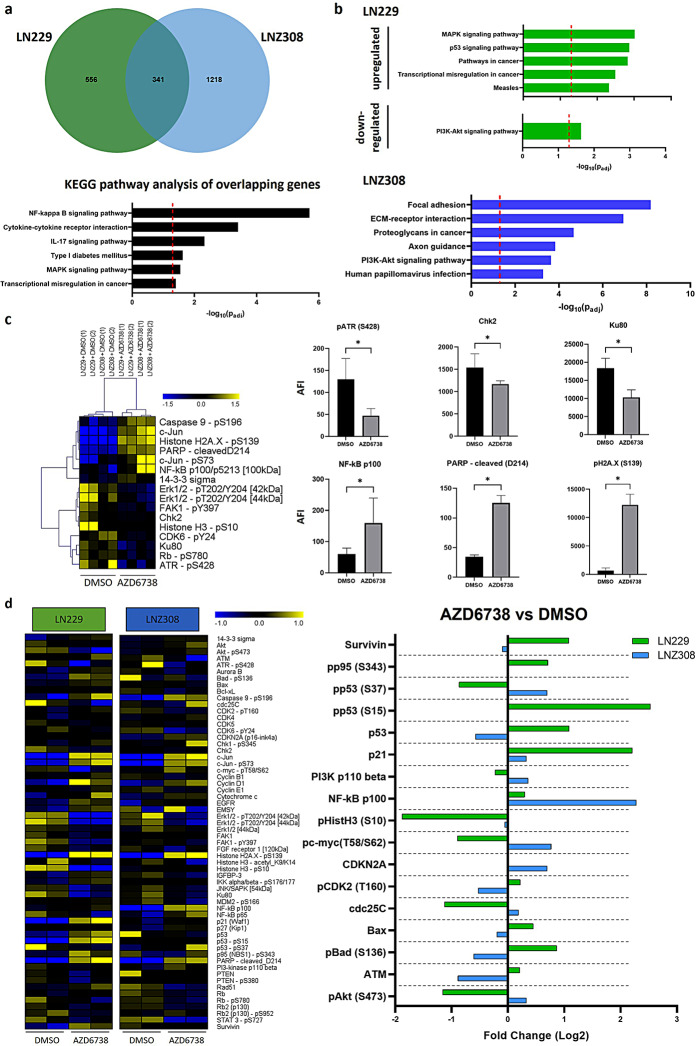
Transcriptomic and proteomic profiling before and after ATRi treatment. a, Venn diagram of upregulated differentially expressed genes (DEGs) in LN229 (n = 3) and LNZ308 (n = 3) cells treated with AZD6738 for 72 h. 341 upregulated genes are identified to overlap in both cell lines upon treatment. Lower panel depicts KEGG pathway analysis of identified overlapping genes. Red dashed line indicates significance level of p < 0.05. b, Based on the likelihood ratio test (LRT), genes identified to be differentially affected upon ATRi treatment in between cell lines are analyzed for KEGG pathway affiliation. p53 signaling is strongly upregulated in LN229 cells, PI3K-Akt signaling is downregulated in LN229 and upregulated in LNZ308 cells. Red dashed line indicates significance level of p < 0.05. c, DigiWest protein profiling heatmap depicting treatment- specific effects across both cell lines confirming target engagement (pATR), apoptosis induction (cleaved PARP), NFκB activation (NF-κB p100) and cell-cycle regulation (Chk2). Statistical analysis of significance for heatmap using Wilcoxon test (non-parametric, p < 0.05), for bar graphs Mann-Whitney test (non-parametric, rank comparison, p < 0.05. DMSO vs. AZD6738, LN229 n = 2, LNZ308 n = 2). d, Left, heatmap depicting indicated analytes separated by cell line. Right, bar graph depicting analytes differentially regulated in both cell lines upon treatment. In line with transcriptomic data, p53 is upregulated in LN229 cells while pAkt is downregulated in LN229 cells and trends towards upregulation in LNZ308 cells upon treatment

Acknowledgments
This image is the copyrighted work of the attributed author or publisher, and ZFIN has permission only to display this image to its users. Additional permissions should be obtained from the applicable author or publisher of the image. Full text @ J. Exp. Clin. Cancer Res.